Altisource Asset Management Corp Com (AAMC): Price and Financial Metrics
AAMC Price/Volume Stats
Current price | $3.98 | 52-week high | $30.44 |
Prev. close | $3.66 | 52-week low | $1.84 |
Day low | $3.55 | Volume | 73,200 |
Day high | $5.00 | Avg. volume | 31,713 |
50-day MA | $4.33 | Dividend yield | N/A |
200-day MA | $7.08 | Market Cap | 11.00M |
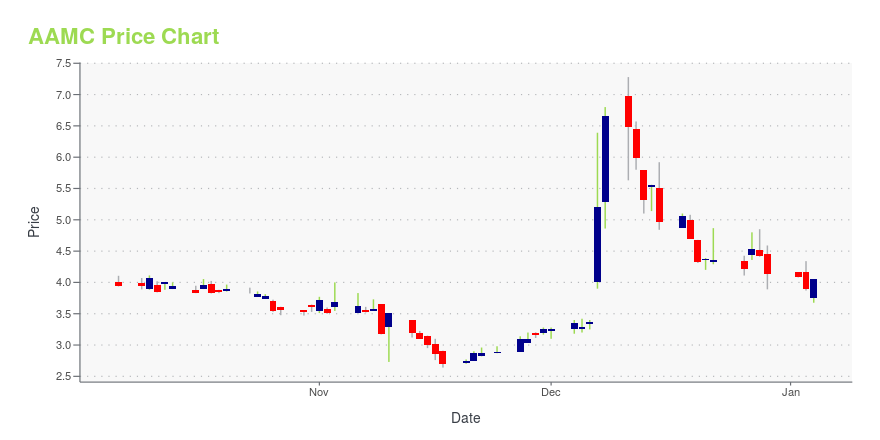
AAMC Stock Price Chart Interactive Chart >
AAMC POWR Grades
- AAMC scores best on the Sentiment dimension, with a Sentiment rank ahead of 66.71% of US stocks.
- The strongest trend for AAMC is in Growth, which has been heading down over the past 152 days.
- AAMC ranks lowest in Growth; there it ranks in the 0th percentile.
AAMC Stock Summary
- With a year-over-year growth in debt of -80.19%, ALTISOURCE ASSET MANAGEMENT CORP's debt growth rate surpasses merely 2.11% of about US stocks.
- In terms of volatility of its share price, AAMC is more volatile than 98.09% of stocks we're observing.
- Shareholder yield, a measure of how much is returned to shareholders via dividends and share repurchases, for AAMC comes in at 417.53% -- higher than that of 99.3% of stocks in our set.
- Stocks with similar financial metrics, market capitalization, and price volatility to ALTISOURCE ASSET MANAGEMENT CORP are SGLY, ATIF, APEI, MD, and QRHC.
- AAMC's SEC filings can be seen here. And to visit ALTISOURCE ASSET MANAGEMENT CORP's official web site, go to www.altisourceamc.com.
AAMC Valuation Summary
- AAMC's price/sales ratio is 2.1; this is 22.22% lower than that of the median Financial Services stock.
- AAMC's price/earnings ratio has moved up 1.3 over the prior 134 months.
Below are key valuation metrics over time for AAMC.
Stock | Date | P/S | P/B | P/E | EV/EBIT |
---|---|---|---|---|---|
AAMC | 2023-12-22 | 2.1 | -0.1 | -0.5 | -0.7 |
AAMC | 2023-12-21 | 2.1 | -0.1 | -0.5 | -0.7 |
AAMC | 2023-12-20 | 2.1 | -0.1 | -0.5 | -0.7 |
AAMC | 2023-12-19 | 2.3 | -0.1 | -0.5 | -0.8 |
AAMC | 2023-12-18 | 2.5 | -0.1 | -0.6 | -0.8 |
AAMC | 2023-12-15 | 2.4 | -0.1 | -0.6 | -0.8 |
AAMC Growth Metrics
- The 5 year cash and equivalents growth rate now stands at -45.78%.
- Its 2 year price growth rate is now at -33.32%.
- The year over year net cashflow from operations growth rate now stands at -200.09%.
The table below shows AAMC's growth in key financial areas (numbers in millions of US dollars).
Date | Revenue | Operating Cash Flow | Net Income to Common Stock |
---|---|---|---|
2022-09-30 | 2.439 | -26.622 | -20.206 |
2022-06-30 | 0.533 | -24.798 | -21.917 |
2022-03-31 | 0 | -19.813 | -15.557 |
2021-12-31 | 0 | -17.676 | -6.004 |
2021-09-30 | 0 | -2.177 | 42.046 |
2021-06-30 | 0 | 17.211 | 59.497 |
AAMC's Quality Factors
The “Quality” component of the POWR Ratings focuses on 31 different factors of a companies fundamentals and operational strength. Here are some key insights as we drill into the specifics of these quality attributes.- AAMC has a Quality Grade of C, ranking ahead of 70.96% of graded US stocks.
- AAMC's asset turnover comes in at 0 -- ranking 62nd of 63 Real Estate stocks.
- HPP, INTG, and UE are the stocks whose asset turnover ratios are most correlated with AAMC.
The table below shows AAMC's key quality metrics over time.
Period | Asset Turnover | Gross Margin | ROIC |
---|---|---|---|
2021-06-30 | 0.000 | NA | 2.531 |
2021-03-31 | 0.048 | 1 | 2.571 |
2021-03-31 | 0.048 | 1 | 2.571 |
2020-12-31 | 0.000 | NA | 1.404 |
2020-09-30 | 0.211 | 1 | -0.088 |
2020-06-30 | 0.327 | 1 | -0.566 |
Latest AAMC News From Around the Web
Below are the latest news stories about ALTISOURCE ASSET MANAGEMENT CORP that investors may wish to consider to help them evaluate AAMC as an investment opportunity.
Today’s Biggest Pre-Market Stock Movers: 10 Top Gainers and Losers on WednesdayPre-market stock movers are a hot topic on Wednesday and we're starting the day with a breakdown of the biggest ones worth watching! |
Rivian (RIVN) Stock Just Scored a New ‘Buy’ RatingRivian stock is gaining on Thursday after Stifel weighed in on RIVN shares with a buy rating and set a price target of $23 per share. |
Why Is Altisource Asset Management (AAMC) Stock Up 24% Today?Altisource Asset Management stock is up Thursday as AAMC investors celebrate it making progress in a legal battle with Blackrock and PIMCO. |
Why Is Troika Media Group (TRKA) Stock Down 77% Today?Troika Media Group stock is falling hard on Thursday as investors in TRKA react to the company filing for Chapter 11 bankruptcy. |
Why Is ZyVersa Therapeutics (ZVSA) Stock Down 44% Today?ZyVersa Therapeutics stock is falling hard on Thursday after the company priced a public offering for shares of ZVSA this morning. |
AAMC Price Returns
1-mo | -10.96% |
3-mo | -7.87% |
6-mo | -4.43% |
1-year | -73.00% |
3-year | N/A |
5-year | N/A |
YTD | -3.86% |
2023 | -30.49% |
2022 | N/A |
2021 | N/A |
2020 | N/A |
2019 | N/A |
Continue Researching AAMC
Want to see what other sources are saying about Altisource Asset Management Corp's financials and stock price? Try the links below:Altisource Asset Management Corp (AAMC) Stock Price | Nasdaq
Altisource Asset Management Corp (AAMC) Stock Quote, History and News - Yahoo Finance
Altisource Asset Management Corp (AAMC) Stock Price and Basic Information | MarketWatch
Loading social stream, please wait...