Altisource Asset Management Corp Com (AAMC): Price and Financial Metrics
AAMC Price/Volume Stats
Current price | $7.08 | 52-week high | $51.75 |
Prev. close | $7.12 | 52-week low | $3.13 |
Day low | $6.93 | Volume | 33,788 |
Day high | $7.42 | Avg. volume | 61,387 |
50-day MA | $12.76 | Dividend yield | N/A |
200-day MA | $24.05 | Market Cap | 12.50M |
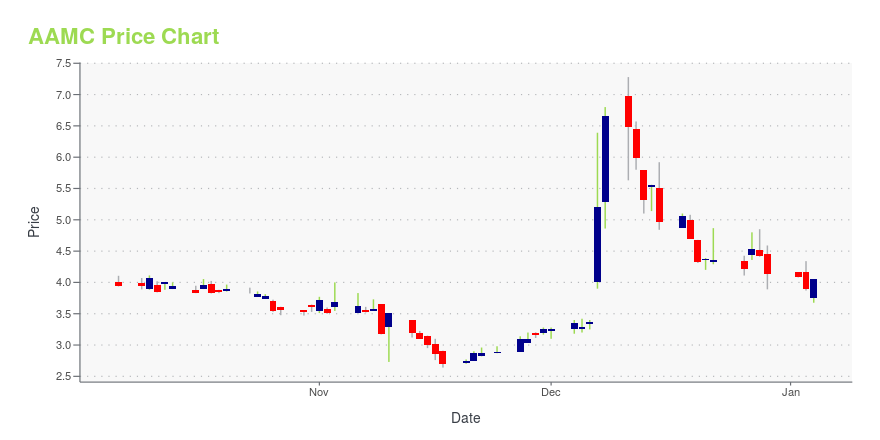
AAMC Stock Price Chart Interactive Chart >
AAMC POWR Grades
- AAMC scores best on the Momentum dimension, with a Momentum rank ahead of 56.1% of US stocks.
- AAMC's strongest trending metric is Stability; it's been moving down over the last 179 days.
- AAMC's current lowest rank is in the Stability metric (where it is better than 2.94% of US stocks).
AAMC Stock Summary
- With a year-over-year growth in debt of 5,564.83%, ALTISOURCE ASSET MANAGEMENT CORP's debt growth rate surpasses 99.59% of about US stocks.
- As for revenue growth, note that AAMC's revenue has grown 1,491.56% over the past 12 months; that beats the revenue growth of 99.33% of US companies in our set.
- ALTISOURCE ASSET MANAGEMENT CORP's shareholder yield -- a measure of how much capital is returned to stockholders via dividends and buybacks -- is -310.32%, greater than the shareholder yield of only 2.05% of stocks in our set.
- Stocks with similar financial metrics, market capitalization, and price volatility to ALTISOURCE ASSET MANAGEMENT CORP are CHNR, CVRX, COLB, PUMP, and VLCN.
- AAMC's SEC filings can be seen here. And to visit ALTISOURCE ASSET MANAGEMENT CORP's official web site, go to www.altisourceamc.com.
AAMC Valuation Summary
- AAMC's price/sales ratio is 1.4; this is 40% higher than that of the median Financial Services stock.
- Over the past 130 months, AAMC's price/sales ratio has gone NA NA.
Below are key valuation metrics over time for AAMC.
Stock | Date | P/S | P/B | P/E | EV/EBIT |
---|---|---|---|---|---|
AAMC | 2023-09-15 | 1.4 | -0.1 | -0.8 | -3.7 |
AAMC | 2023-09-14 | 1.4 | -0.1 | -0.8 | -3.7 |
AAMC | 2023-09-13 | 1.4 | -0.1 | -0.8 | -3.7 |
AAMC | 2023-09-12 | 1.4 | -0.1 | -0.8 | -3.7 |
AAMC | 2023-09-11 | 1.5 | -0.1 | -0.8 | -3.7 |
AAMC | 2023-09-08 | 1.3 | -0.1 | -0.7 | -3.6 |
AAMC Growth Metrics
- The 5 year cash and equivalents growth rate now stands at -45.78%.
- Its 2 year price growth rate is now at -33.32%.
- The year over year net cashflow from operations growth rate now stands at -200.09%.

The table below shows AAMC's growth in key financial areas (numbers in millions of US dollars).
Date | Revenue | Operating Cash Flow | Net Income to Common Stock |
---|---|---|---|
2022-09-30 | 2.439 | -26.622 | -20.206 |
2022-06-30 | 0.533 | -24.798 | -21.917 |
2022-03-31 | 0 | -19.813 | -15.557 |
2021-12-31 | 0 | -17.676 | -6.004 |
2021-09-30 | 0 | -2.177 | 42.046 |
2021-06-30 | 0 | 17.211 | 59.497 |
AAMC's Quality Factors
The “Quality” component of the POWR Ratings focuses on 31 different factors of a companies fundamentals and operational strength. Here are some key insights as we drill into the specifics of these quality attributes.- AAMC has a Quality Grade of C, ranking ahead of 70.96% of graded US stocks.
- AAMC's asset turnover comes in at 0 -- ranking 62nd of 63 Real Estate stocks.
- HPP, INTG, and UE are the stocks whose asset turnover ratios are most correlated with AAMC.
The table below shows AAMC's key quality metrics over time.
Period | Asset Turnover | Gross Margin | ROIC |
---|---|---|---|
2021-06-30 | 0.000 | NA | 2.531 |
2021-03-31 | 0.048 | 1 | 2.571 |
2021-03-31 | 0.048 | 1 | 2.571 |
2020-12-31 | 0.000 | NA | 1.404 |
2020-09-30 | 0.211 | 1 | -0.088 |
2020-06-30 | 0.327 | 1 | -0.566 |
Latest AAMC News From Around the Web
Below are the latest news stories about ALTISOURCE ASSET MANAGEMENT CORP that investors may wish to consider to help them evaluate AAMC as an investment opportunity.
Altisource Asset Management Corporation Reports a Stock Dividend in Lieu of a Stock Split and Appointment of New CFOCHRISTIANSTED, U.S. Virgin Islands, September 08, 2023--Altisource Asset Management Corporation ("AAMC" or the "Company") (NYSE American: AAMC) announces that the Board of Directors has elected to cancel the previously reported 2 for 1 common stock split and instead is proceeding with a 70% stock dividend. The Board also announces the promotion of Richard Rodick, previously Vice President, Finance, to Chief Financial Officer. Mr. Rodick succeeds previous CFO Stephen Krallman, who is resigning fr |
Altisource Asset Management Corporation Announces Departure of CEOCHRISTIANSTED, U.S. Virgin Islands, August 30, 2023--Altisource Asset Management Corporation ("AAMC" or the "Company") (NYSE American: AAMC) announces the resignation of Chief Executive Officer, Jason Kopcak. |
Discover Financial Services (DFS) Stock Falls on CEO ResignationDiscover Financial Services (DFS) stock is falling on Tuesday after the financial services company announced the resignation of its CEO. |
NVDA Stock Alert: Analysts Are Hiking Their Nvidia Price TargetsNvidia (NVDA) stock is a hot topic among traders on Tuesday as several analysts have increased their price targets for the shares. |
Why Is Altisource Asset Management (AAMC) Stock Down 66% Today?Altisource Asset Management AAMC) stock is taking a beating on Tuesday after releasing its earnings report for the second quarter of 2023. |
AAMC Price Returns
1-mo | 70.81% |
3-mo | -75.07% |
6-mo | -77.09% |
1-year | -23.46% |
3-year | N/A |
5-year | N/A |
YTD | -30.07% |
2022 | N/A |
2021 | N/A |
2020 | N/A |
2019 | N/A |
2018 | N/A |
Continue Researching AAMC
Want to see what other sources are saying about Altisource Asset Management Corp's financials and stock price? Try the links below:Altisource Asset Management Corp (AAMC) Stock Price | Nasdaq
Altisource Asset Management Corp (AAMC) Stock Quote, History and News - Yahoo Finance
Altisource Asset Management Corp (AAMC) Stock Price and Basic Information | MarketWatch
Loading social stream, please wait...