Advance Auto Parts Inc. (AAP): Price and Financial Metrics

Advance Auto Parts Inc. (AAP): $85.09

0.23 (-0.27%)

POWR Rating

Component Grades

Momentum

C

Stability

D

Sentiment

Quality

B

Add AAP to Watchlist
Sign Up

Industry: Auto Parts

Industry

A

Ranked

#51 of 62

in industry

AAP Price/Volume Stats

Current price $85.09 52-week high $129.90
Prev. close $85.32 52-week low $47.73
Day low $85.03 Volume 1,459,800
Day high $86.31 Avg. volume 1,921,449
50-day MA $70.72 Dividend yield 1.19%
200-day MA $63.86 Market Cap 5.07B

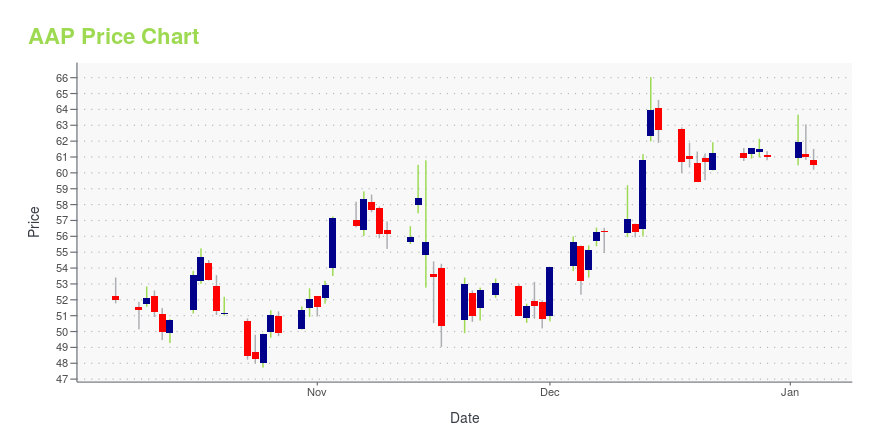
AAP Stock Price Chart Interactive Chart >

AAP POWR Grades

  • AAP scores best on the Quality dimension, with a Quality rank ahead of 87.79% of US stocks.
  • AAP's strongest trending metric is Growth; it's been moving down over the last 26 weeks.
  • AAP's current lowest rank is in the Sentiment metric (where it is better than 0.6% of US stocks).

AAP Stock Summary

  • ADVANCE AUTO PARTS INC's capital turnover -- a measure of revenue relative to shareholder's equity -- is better than 88.36% of US listed stocks.
  • With a price/sales ratio of 0.32, ADVANCE AUTO PARTS INC has a higher such ratio than merely 10.27% of stocks in our set.
  • In terms of volatility of its share price, AAP is more volatile than 88.16% of stocks we're observing.
  • Stocks that are quantitatively similar to AAP, based on their financial statements, market capitalization, and price volatility, are PAHC, ARHS, M, SIGI, and CRI.
  • AAP's SEC filings can be seen here. And to visit ADVANCE AUTO PARTS INC's official web site, go to www.advanceautoparts.com.

AAP Valuation Summary

  • In comparison to the median Consumer Cyclical stock, AAP's price/sales ratio is 85% lower, now standing at 0.3.
  • Over the past 243 months, AAP's price/sales ratio has gone down 0.6.

Below are key valuation metrics over time for AAP.

Stock Date P/S P/B P/E EV/EBIT
AAP 2023-12-29 0.3 1.4 19.5 22.6
AAP 2023-12-28 0.3 1.4 19.7 22.7
AAP 2023-12-27 0.3 1.4 19.7 22.7
AAP 2023-12-26 0.3 1.4 19.5 22.6
AAP 2023-12-22 0.3 1.4 19.6 22.6
AAP 2023-12-21 0.3 1.4 19.4 22.5

AAP Growth Metrics

    Its year over year net cashflow from operations growth rate is now at -43.56%.
  • Its 3 year net cashflow from operations growth rate is now at -15.58%.
  • Its year over year price growth rate is now at -5.8%.
AAP's revenue has moved up $1,368,949,000 over the prior 33 months.

The table below shows AAP's growth in key financial areas (numbers in millions of US dollars).

Date Revenue Operating Cash Flow Net Income to Common Stock
2022-09-30 11,077.95 670.42 476.844
2022-06-30 11,057.84 644.646 535.675
2022-03-31 11,041.83 727.39 569.969
2021-12-31 10,997.99 1,112.262 616.108
2021-09-30 10,966.15 1,085.406 646.436
2021-06-30 10,886.84 1,297.637 624.099

AAP's Quality Factors

The “Quality” component of the POWR Ratings focuses on 31 different factors of a companies fundamentals and operational strength. Here are some key insights as we drill into the specifics of these quality attributes.
  • AAP has a Quality Grade of A, ranking ahead of 96.5% of graded US stocks.
  • AAP's asset turnover comes in at 0.916 -- ranking 141st of 165 Retail stocks.
  • SCVL, ORLY, and ANF are the stocks whose asset turnover ratios are most correlated with AAP.

The table below shows AAP's key quality metrics over time.

Period Asset Turnover Gross Margin ROIC
2021-07-17 0.916 0.449 0.113
2021-04-24 0.902 0.446 0.115
2021-01-02 0.845 0.443 0.089
2020-10-03 0.835 0.439 0.087
2020-07-11 0.830 0.437 0.083
2020-04-18 0.828 0.436 0.072

AAP Price Target

For more insight on analysts targets of AAP, see our AAP price target page. And for a list of of all stocks sorted by upside potential based on analyst target price, see our Top Price Target page.

Average Price Target $232.94 Average Broker Recommendation 1.58 (Moderate Buy)

Advance Auto Parts Inc. (AAP) Company Bio


Advance Auto Parts, Inc. (Advance) is an American automotive aftermarket parts provider. Headquartered in Raleigh, North Carolina, it serves both professional installer and do it yourself (DIY) customers. As of July 13, 2019, Advance operated 4,912 stores and 150 Worldpac branches in the United States and Canada. The Company also serves 1,250 independently owned Carquest branded stores across these locations in addition to Mexico, the Bahamas, Turks and Caicos and British Virgin Islands. The company retails various brand name, original equipment manufacturer (OEM) and private label automotive replacement parts, accessories, batteries and maintenance items for domestic and imported cars, vans, sport utility vehicles and light and heavy duty trucks. (Source:Wikipedia)


AAP Latest News Stream


Event/Time News Detail
Loading, please wait...

AAP Latest Social Stream


Loading social stream, please wait...

View Full AAP Social Stream

Latest AAP News From Around the Web

Below are the latest news stories about ADVANCE AUTO PARTS INC that investors may wish to consider to help them evaluate AAP as an investment opportunity.

Carvana and Carrols Were 2 of the Biggest Winners in 2023, Up Over 1,100% and Over 400%, Respectively. Here Are 3 Stocks With Similar Setups for 2024.

These stocks might be set up for a big run, but what about the underlying businesses?

Yahoo | December 27, 2023

CarMax (KMX) Tops Q3 Earnings Expectations, Lags Sales Mark

While CarMax's (KMX) bottom line improves year over year and surpasses estimates, the top line contracts year over year and misses the Zacks Consensus Estimate.

Yahoo | December 22, 2023

Why Is Advance Auto Parts (AAP) Up 19.8% Since Last Earnings Report?

Advance Auto Parts (AAP) reported earnings 30 days ago. What's next for the stock? We take a look at earnings estimates for some clues.

Yahoo | December 15, 2023

Is Advance Auto Parts Stock a Buy?

In my opinion, it's best to avoid the business altogether. Let's take a closer look at Advance Auto Parts. Shares of Advance Auto Parts have gotten so hammered as a direct result of disappointing financial results.

Yahoo | November 30, 2023

Can AutoZone (AZO) Keep Its Beat Streak Alive in Q1 Earnings?

The Zacks Consensus Estimate for AutoZone's (AZO) fiscal first-quarter earnings and revenues is pegged at $30.82 per share and $4.17 billion, respectively.

Yahoo | November 28, 2023

Read More 'AAP' Stories Here

AAP Price Returns

1-mo 31.41%
3-mo 40.00%
6-mo 53.51%
1-year -25.78%
3-year -50.46%
5-year -45.69%
YTD 40.00%
2023 -57.62%
2022 -36.50%
2021 54.68%
2020 -0.89%
2019 1.87%

AAP Dividends

Ex-Dividend Date Type Payout Amount Change
Loading, please wait...
View Full AAP Dividend History

Get Free Updates

Join thousands of investors who get the latest news, insights and top rated picks from StockNews.com!