Advance Auto Parts Inc. (AAP): Price and Financial Metrics
GET POWR RATINGS... FREE!
AAP POWR Grades
- AAP scores best on the Quality dimension, with a Quality rank ahead of 93.13% of US stocks.
- AAP's strongest trending metric is Quality; it's been moving down over the last 179 days.
- AAP ranks lowest in Sentiment; there it ranks in the 18th percentile.
AAP Stock Summary
- The capital turnover (annual revenue relative to shareholder's equity) for AAP is 4.16 -- better than 88.63% of US stocks.
- Of note is the ratio of ADVANCE AUTO PARTS INC's sales and general administrative expense to its total operating expenses; 87.08% of US stocks have a lower such ratio.
- ADVANCE AUTO PARTS INC's shareholder yield -- a measure of how much capital is returned to stockholders via dividends and buybacks -- is 9.24%, greater than the shareholder yield of 81.86% of stocks in our set.
- Stocks that are quantitatively similar to AAP, based on their financial statements, market capitalization, and price volatility, are FIX, TLYS, HNI, CNXN, and TITN.
- AAP's SEC filings can be seen here. And to visit ADVANCE AUTO PARTS INC's official web site, go to www.advanceautoparts.com.
AAP Valuation Summary
- AAP's price/earnings ratio is 14.1; this is 11.02% higher than that of the median Consumer Cyclical stock.
- AAP's price/sales ratio has moved down 0.1 over the prior 243 months.
Below are key valuation metrics over time for AAP.
Stock | Date | P/S | P/B | P/E | EV/EBIT |
---|---|---|---|---|---|
AAP | 2023-03-17 | 0.6 | 2.6 | 14.1 | 14.9 |
AAP | 2023-03-16 | 0.6 | 2.7 | 14.4 | 15.2 |
AAP | 2023-03-15 | 0.6 | 2.7 | 14.4 | 15.1 |
AAP | 2023-03-14 | 0.6 | 2.7 | 14.4 | 15.1 |
AAP | 2023-03-13 | 0.7 | 2.8 | 14.7 | 15.4 |
AAP | 2023-03-10 | 0.7 | 2.8 | 15.1 | 15.7 |
AAP Growth Metrics
- Its year over year net cashflow from operations growth rate is now at -43.56%.
- Its 3 year net cashflow from operations growth rate is now at -15.58%.
- Its year over year price growth rate is now at -5.8%.

The table below shows AAP's growth in key financial areas (numbers in millions of US dollars).
Date | Revenue | Operating Cash Flow | Net Income to Common Stock |
---|---|---|---|
2022-09-30 | 11,077.95 | 670.42 | 476.844 |
2022-06-30 | 11,057.84 | 644.646 | 535.675 |
2022-03-31 | 11,041.83 | 727.39 | 569.969 |
2021-12-31 | 10,997.99 | 1,112.262 | 616.108 |
2021-09-30 | 10,966.15 | 1,085.406 | 646.436 |
2021-06-30 | 10,886.84 | 1,297.637 | 624.099 |
AAP's Quality Factors
The “Quality” component of the POWR Ratings focuses on 31 different factors of a companies fundamentals and operational strength. Here are some key insights as we drill into the specifics of these quality attributes.- AAP has a Quality Grade of A, ranking ahead of 96.5% of graded US stocks.
- AAP's asset turnover comes in at 0.916 -- ranking 141st of 165 Retail stocks.
- SCVL, ORLY, and ANF are the stocks whose asset turnover ratios are most correlated with AAP.
The table below shows AAP's key quality metrics over time.
Period | Asset Turnover | Gross Margin | ROIC |
---|---|---|---|
2021-07-17 | 0.916 | 0.449 | 0.113 |
2021-04-24 | 0.902 | 0.446 | 0.115 |
2021-01-02 | 0.845 | 0.443 | 0.089 |
2020-10-03 | 0.835 | 0.439 | 0.087 |
2020-07-11 | 0.830 | 0.437 | 0.083 |
2020-04-18 | 0.828 | 0.436 | 0.072 |
AAP Price Target
For more insight on analysts targets of AAP, see our AAP price target page. And for a list of of all stocks sorted by upside potential based on analyst target price, see our Top Price Target page.
Average Price Target | $232.94 | Average Broker Recommendation | 1.58 (Moderate Buy) |
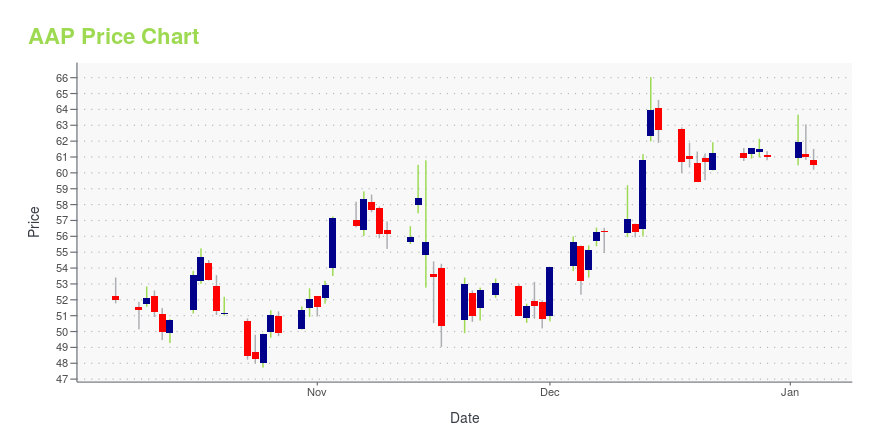
AAP Stock Price Chart Interactive Chart >
AAP Price/Volume Stats
Current price | $110.83 | 52-week high | $231.43 |
Prev. close | $111.14 | 52-week low | $109.05 |
Day low | $109.05 | Volume | 2,010,000 |
Day high | $111.20 | Avg. volume | 1,358,265 |
50-day MA | $140.39 | Dividend yield | 5.4% |
200-day MA | $164.01 | Market Cap | 6.57B |
Advance Auto Parts Inc. (AAP) Company Bio
Advance Auto Parts, Inc. (Advance) is an American automotive aftermarket parts provider. Headquartered in Raleigh, North Carolina, it serves both professional installer and do it yourself (DIY) customers. As of July 13, 2019, Advance operated 4,912 stores and 150 Worldpac branches in the United States and Canada. The Company also serves 1,250 independently owned Carquest branded stores across these locations in addition to Mexico, the Bahamas, Turks and Caicos and British Virgin Islands. The company retails various brand name, original equipment manufacturer (OEM) and private label automotive replacement parts, accessories, batteries and maintenance items for domestic and imported cars, vans, sport utility vehicles and light and heavy duty trucks. (Source:Wikipedia)
Latest AAP News From Around the Web
Below are the latest news stories about ADVANCE AUTO PARTS INC that investors may wish to consider to help them evaluate AAP as an investment opportunity.
Is There An Opportunity With Advance Auto Parts, Inc.'s (NYSE:AAP) 32% Undervaluation?Key Insights The projected fair value for Advance Auto Parts is US$174 based on 2 Stage Free Cash Flow to Equity... |
Advance Auto Parts, Inc. (NYSE:AAP) Q4 2022 Earnings Call TranscriptAdvance Auto Parts, Inc. (NYSE:AAP) Q4 2022 Earnings Call Transcript February 28, 2023 Operator: Hello and welcome to the Advance Auto Parts Fourth Quarter and Full Year 2022 Conference Call. Before we begin, Elisabeth Eisleben, Senior Vice President, Communications and Investor Relations, will make a brief statement concerning forward-looking statements that will be discussed on […] |
Auto Roundup: LKQ's Big Buyout & STLA's Electrification Push Grab EyeballsWhile LKQ is set to acquire Uni-Select for $2.1 billion, Stellantis (STLA) is revving up its EV game by investing $155 million each in two separate projects. |
Raleigh's Fortune 500 CEO is retiring. But is the job done?When Tom Greco took over as CEO of Advance Auto Parts in 2016, his goal was to execute a turnaround for the retailer. The company still has a ways to go. |
Advance Auto's (AAP) Q4 Earnings Beat, Revenues Increase Y/YAdvance Auto (AAP) reports Q4 earnings beat, owing to an increase in comparable store sales and adjusted operating income. |
AAP Price Returns
1-mo | -20.18% |
3-mo | N/A |
6-mo | -29.70% |
1-year | -47.12% |
3-year | 20.67% |
5-year | 2.46% |
YTD | -24.62% |
2022 | -36.50% |
2021 | 54.68% |
2020 | -0.89% |
2019 | 1.87% |
2018 | 58.22% |
AAP Dividends
Ex-Dividend Date | Type | Payout Amount | Change | ||||||
---|---|---|---|---|---|---|---|---|---|
Loading, please wait... |
Continue Researching AAP
Want to do more research on Advance Auto Parts Inc's stock and its price? Try the links below:Advance Auto Parts Inc (AAP) Stock Price | Nasdaq
Advance Auto Parts Inc (AAP) Stock Quote, History and News - Yahoo Finance
Advance Auto Parts Inc (AAP) Stock Price and Basic Information | MarketWatch
Loading social stream, please wait...