American Assets Trust, Inc. (AAT): Price and Financial Metrics
GET POWR RATINGS... FREE!
AAT POWR Grades
- AAT scores best on the Sentiment dimension, with a Sentiment rank ahead of 91.15% of US stocks.
- AAT's strongest trending metric is Stability; it's been moving down over the last 177 days.
- AAT ranks lowest in Quality; there it ranks in the 32nd percentile.
AAT Stock Summary
- AAT's one year PEG ratio, measuring expected growth in earnings next year relative to current common stock price is 165.92 -- higher than 85.01% of US-listed equities with positive expected earnings growth.
- Of note is the ratio of AMERICAN ASSETS TRUST INC's sales and general administrative expense to its total operating expenses; just 8.69% of US stocks have a lower such ratio.
- The ratio of debt to operating expenses for AMERICAN ASSETS TRUST INC is higher than it is for about 92.41% of US stocks.
- Stocks that are quantitatively similar to AAT, based on their financial statements, market capitalization, and price volatility, are EGLE, STNG, CTO, CRK, and DOC.
- AAT's SEC filings can be seen here. And to visit AMERICAN ASSETS TRUST INC's official web site, go to www.americanassetstrust.com.
AAT Valuation Summary
- AAT's EV/EBIT ratio is 33.1; this is 17.38% higher than that of the median Real Estate stock.
- Over the past 147 months, AAT's EV/EBIT ratio has gone down 5.7.
Below are key valuation metrics over time for AAT.
Stock | Date | P/S | P/B | P/E | EV/EBIT |
---|---|---|---|---|---|
AAT | 2023-02-01 | 4.2 | 1.4 | 41.7 | 33.1 |
AAT | 2023-01-31 | 4.1 | 1.4 | 41.0 | 32.8 |
AAT | 2023-01-30 | 4.0 | 1.4 | 40.0 | 32.4 |
AAT | 2023-01-27 | 4.0 | 1.4 | 40.0 | 32.4 |
AAT | 2023-01-26 | 3.9 | 1.3 | 39.3 | 32.1 |
AAT | 2023-01-25 | 3.9 | 1.3 | 39.0 | 32.0 |
AAT Growth Metrics
- Its 4 year price growth rate is now at -34.14%.
- Its 5 year net income to common stockholders growth rate is now at 44.46%.
- Its 2 year net cashflow from operations growth rate is now at 1.62%.

The table below shows AAT's growth in key financial areas (numbers in millions of US dollars).
Date | Revenue | Operating Cash Flow | Net Income to Common Stock |
---|---|---|---|
2022-09-30 | 418.395 | 179.589 | 42.014 |
2022-06-30 | 405.658 | 177.66 | 39.283 |
2022-03-31 | 393.312 | 164.973 | 37.642 |
2021-12-31 | 375.828 | 168.329 | 28.376 |
2021-09-30 | 355.428 | 147.468 | 23.137 |
2021-06-30 | 341.516 | 134.589 | 18.134 |
AAT's Quality Factors
The “Quality” component of the POWR Ratings focuses on 31 different factors of a companies fundamentals and operational strength. Here are some key insights as we drill into the specifics of these quality attributes.- AAT has a Quality Grade of D, ranking ahead of 11.91% of graded US stocks.
- AAT's asset turnover comes in at 0.119 -- ranking 166th of 444 Trading stocks.
- OUT, O, and AINV are the stocks whose asset turnover ratios are most correlated with AAT.
The table below shows AAT's key quality metrics over time.
Period | Asset Turnover | Gross Margin | ROIC |
---|---|---|---|
2021-09-30 | 0.119 | 0.650 | 0.019 |
2021-06-30 | 0.116 | 0.643 | 0.018 |
2021-03-31 | 0.115 | 0.647 | 0.017 |
2020-12-31 | 0.122 | 0.648 | 0.020 |
2020-09-30 | 0.129 | 0.651 | 0.023 |
2020-06-30 | 0.135 | 0.653 | 0.025 |
AAT Price Target
For more insight on analysts targets of AAT, see our AAT price target page. And for a list of of all stocks sorted by upside potential based on analyst target price, see our Top Price Target page.
Average Price Target | $39.80 | Average Broker Recommendation | 1.8 (Moderate Buy) |
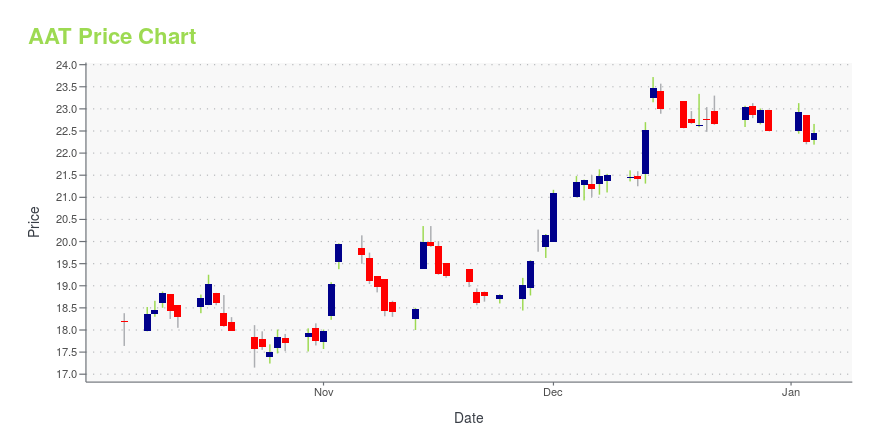
AAT Stock Price Chart Interactive Chart >
AAT Price/Volume Stats
Current price | $28.89 | 52-week high | $39.10 |
Prev. close | $29.66 | 52-week low | $24.00 |
Day low | $28.72 | Volume | 315,000 |
Day high | $29.28 | Avg. volume | 241,174 |
50-day MA | $27.38 | Dividend yield | 4.43% |
200-day MA | $29.04 | Market Cap | 1.75B |
American Assets Trust, Inc. (AAT) Company Bio
American Assets Trust has been acquiring, improving, developing and managing premier retail, office and residential properties throughout the United States. The company was founded in 1967 and is based in San Diego, California.
Latest AAT News From Around the Web
Below are the latest news stories about AMERICAN ASSETS TRUST INC that investors may wish to consider to help them evaluate AAT as an investment opportunity.
American Assets Trust: Long-Term Perspective During DownturnAmerican Assets Trust has been negatively affected by the somewhat persistent work-from-home trend and sky-high inflation. Find out why AAT is a Buy. |
One American Assets Trust, Inc. (NYSE:AAT) insider upped their stake by 0.7% in the previous yearFrom what we can see, insiders were net buyers in American Assets Trust, Inc.'s ( NYSE:AAT ) during the past 12 months... |
American Assets Trust, Inc. Releases Tax Status of 2022 DistributionsSAN DIEGO, Jan. 17, 2023 (GLOBE NEWSWIRE) -- American Assets Trust, Inc. (NYSE: AAT) (the “Company”) announced today the tax treatment of its 2022 dividend distributions as follows: |
American Assets Trust, Inc. Announces Fourth Quarter and Year-End 2022 Earnings Release Date and Conference Call InformationSAN DIEGO, Jan. 12, 2023 (GLOBE NEWSWIRE) -- American Assets Trust, Inc. (NYSE:AAT) (the “Company”) will announce its fourth quarter and year-end 2022 earnings in a press release to be issued after the market closes on Tuesday, February 7, 2023. |
American Assets Trust, Inc. Increases Borrowings and Extends Maturity Date in its Amended and Restated Term Loan AgreementSAN DIEGO, Jan. 05, 2023 (GLOBE NEWSWIRE) -- American Assets Trust, Inc. (NYSE:AAT) (the “Company”) announced today that it has amended and restated its existing term loan agreement. The term loan agreement was amended and restated to, among other things, (1) increase the fully-drawn borrowings from $150 million to $225 million, (2) extend the maturity date from March 1, 2023 to January 5, 2025 (with one, twelve-month extension option) and (3) transition borrowings to the Secured Overnight Finan |
AAT Price Returns
1-mo | 9.43% |
3-mo | 3.48% |
6-mo | -0.11% |
1-year | -14.26% |
3-year | -31.06% |
5-year | 2.12% |
YTD | 9.02% |
2022 | -26.36% |
2021 | 34.03% |
2020 | -35.04% |
2019 | 17.11% |
2018 | 8.14% |
AAT Dividends
Ex-Dividend Date | Type | Payout Amount | Change | ||||||
---|---|---|---|---|---|---|---|---|---|
Loading, please wait... |
Continue Researching AAT
Here are a few links from around the web to help you further your research on American Assets Trust Inc's stock as an investment opportunity:American Assets Trust Inc (AAT) Stock Price | Nasdaq
American Assets Trust Inc (AAT) Stock Quote, History and News - Yahoo Finance
American Assets Trust Inc (AAT) Stock Price and Basic Information | MarketWatch
Loading social stream, please wait...