
AbbVie Inc. (ABBV): Price and Financial Metrics
ABBV Price/Volume Stats
| Current price | $185.16 | 52-week high | $186.85 |
| Prev. close | $182.17 | 52-week low | $135.85 |
| Day low | $182.11 | Volume | 6,948,777 |
| Day high | $186.85 | Avg. volume | 5,572,869 |
| 50-day MA | $167.70 | Dividend yield | 3.58% |
| 200-day MA | $162.51 | Market Cap | 326.97B |
ABBV Stock Price Chart Interactive Chart >
AbbVie Inc. (ABBV) Company Bio
Abbvie develops and markets therapies that address a range of diseases. The Company's products are focused on treating conditions, such as chronic autoimmune diseases, including rheumatoid arthritis, psoriasis and Crohn's disease, hepatitis C, human immunodeficiency virus, endometriosis, thyroid disease, Parkinson's disease, complications associated with chronic kidney disease and cystic fibrosis, and other health conditions, such as low testosterone. The company was founded in 2012 and is based in North Chicago, Illinois.
Latest ABBV News From Around the Web
Below are the latest news stories about ABBVIE INC that investors may wish to consider to help them evaluate ABBV as an investment opportunity.
The 3 Hottest Dividend Stocks to Watch in 2024You know what I hate about the typical article about hottest dividend stocks to watch? |
Top 15 Value Stocks to Buy for 2024In this article, we discuss top 15 value stocks to buy for 2024 picked by Joel Greenblatt. To skip the details about Mr. Greenblatt’s life, portfolio performance, and investment strategy, go directly to Top 5 Value Stocks to Buy for 2024. Investing offers an exciting and effective way of growing wealth over time. Value investing is […] |
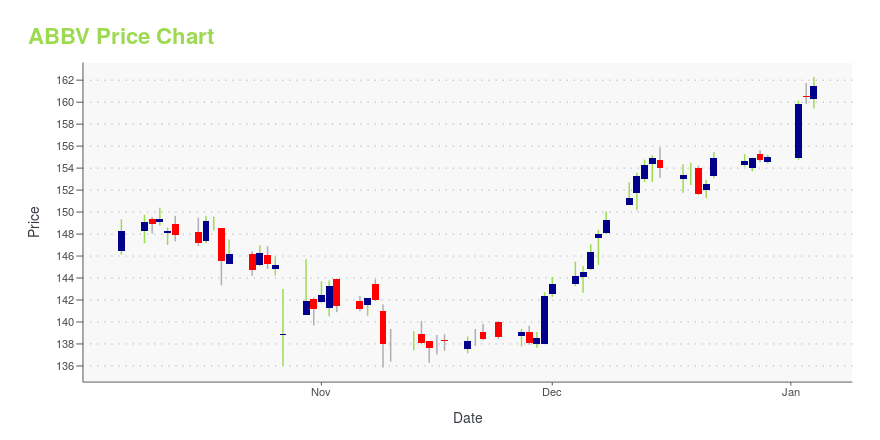
AbbVie (ABBV) Laps the Stock Market: Here's WhyAbbVie (ABBV) closed at $154.88 in the latest trading session, marking a +0.17% move from the prior day. |
AstraZeneca (AZN) Set to Acquire Gracell for $1.2 BillionAstraZeneca (AZN) is set to acquire clinical-stage biopharmaceutical company, Gracell, for a total deal value of up to $1.2 billion. |
A Tale of Two Pharmas: Can Obesity Firms Continue Their Outperformance in 2024?In pharma, a company can take a larger slice of the healthcare pie than peers, but it is still constrained by the size of the pie. |
ABBV Price Returns
| 1-mo | 9.18% |
| 3-mo | 17.07% |
| 6-mo | 14.72% |
| 1-year | 29.20% |
| 3-year | 76.60% |
| 5-year | 240.84% |
| YTD | 22.87% |
| 2023 | -0.23% |
| 2022 | 24.01% |
| 2021 | 32.43% |
| 2020 | 27.72% |
| 2019 | 1.47% |
ABBV Dividends
| Ex-Dividend Date | Type | Payout Amount | Change | ||||||
|---|---|---|---|---|---|---|---|---|---|
| Loading, please wait... | |||||||||
Continue Researching ABBV
Want to do more research on AbbVie Inc's stock and its price? Try the links below:AbbVie Inc (ABBV) Stock Price | Nasdaq
AbbVie Inc (ABBV) Stock Quote, History and News - Yahoo Finance
AbbVie Inc (ABBV) Stock Price and Basic Information | MarketWatch
Loading social stream, please wait...