
Associated Capital Group, Inc. (AC): Price and Financial Metrics
AC Price/Volume Stats
| Current price | $33.51 | 52-week high | $38.64 |
| Prev. close | $33.46 | 52-week low | $28.58 |
| Day low | $33.12 | Volume | 1,609 |
| Day high | $33.71 | Avg. volume | 6,097 |
| 50-day MA | $33.29 | Dividend yield | 0.61% |
| 200-day MA | $33.49 | Market Cap | 717.15M |
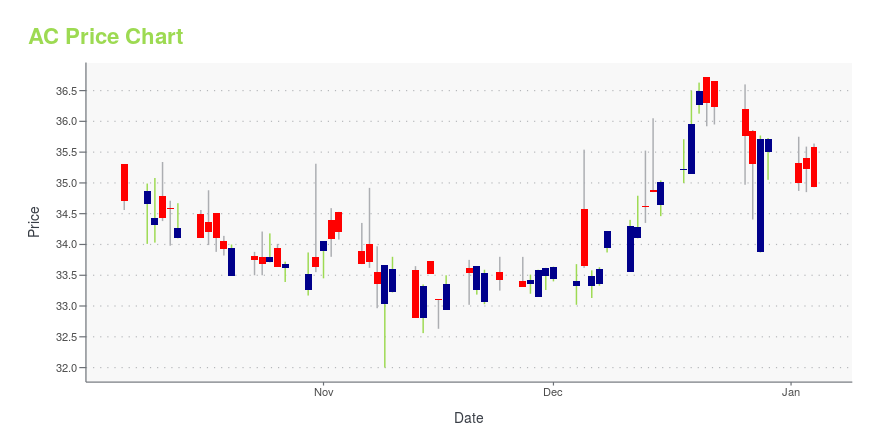
AC Stock Price Chart Interactive Chart >
Associated Capital Group, Inc. (AC) Company Bio
Associated Capital Group, Inc. provides investment advisory services The company is involved in alternative investment management business. It also offers institutional research services, as well as operates as an underwriter. Associated Capital Group, Inc. is based in Rye, New York.
Latest AC News From Around the Web
Below are the latest news stories about ASSOCIATED CAPITAL GROUP INC that investors may wish to consider to help them evaluate AC as an investment opportunity.
Associated Capital Group, Inc. Reports Third Quarter ResultsNA NA Deals...Deals...Y Más Deals Arbitraje de Riesgo - El anuncio de una fusión es el comienzo de una oportunidad Merger Masters Tales of Arbitrage Merger Masters (Japanese) Tales of Arbitrage – Book Value per share ended the quarter at $41.43 per share vs $39.96 at September 30, 2022 – AUM: $1.59 billion at September 30, 2023 compared to $1.75 billion at September 30, 2022 – Approved $4.3 million shareholder designated charitable contribution for registered shareholders, bringing total to $38 |
Associated Capital Group, Inc. Announces Changes to Management TeamGREENWICH, Conn., Nov. 08, 2023 (GLOBE NEWSWIRE) -- Associated Capital Group, Inc. (NYSE: AC, “Associated Capital” or the “Company”) announced today that Ian McAdams has been named Chief Financial Officer of the Company. Mr. McAdams joined the Company’s finance team in 2021 and has served as Interim Co-Chief Financial Officer since July 2022. Prior to joining Associated Capital, Mr. McAdams was a Manager in Banking and Capital Markets with Ernst & Young LLP where his primary focus was providing |
AC Reports Preliminary September 30 Book Value of $41.35 to $41.55 Per ShareGREENWICH, Conn., Oct. 09, 2023 (GLOBE NEWSWIRE) -- Associated Capital Group, Inc. (“AC” or the “Company”) (NYSE: AC), announced today a preliminary range for its third quarter book value of $41.35 to $41.55 per share. This compares to $41.41 per share at June 30, 2023, $40.48 per share at December 31, 2022 and $39.96 per share at September 30, 2022. Assets under management were $1.59 billion at September 30, 2023, compared to $1.75 billion at September 30, 2022. AC will be issuing further detai |
Air Canada Highlights ESG Accomplishments with 2022 Citizens of the World Corporate Sustainability ReportAir Canada today released the 2022 edition of Citizens of the World, detailing the airline's approach, commitments and progress respecting its environmental, social and governance activities and performance throughout 2022. The report also outlines Air Canada's ambitions for the future. |
Associated Capital Group Sets Record Date for 2023 Shareholder Designated Charitable ContributionGREENWICH, Conn., Aug. 22, 2023 (GLOBE NEWSWIRE) -- Associated Capital Group, Inc. (NYSE: AC) has set October 15, 2023 as the record date for its 2023 Shareholder Designated Charitable Contribution (“SDCC”). AC previously announced the approval of a $0.20 per share SDCC for all registered Class A and Class B shareholders. To be eligible, shareholders will have until October 15, 2023 to register shares directly with Computershare, AC’s transfer agent. Shareholders can then designate a 501(c)(3) c |
AC Price Returns
| 1-mo | -1.73% |
| 3-mo | 3.95% |
| 6-mo | -2.59% |
| 1-year | -8.82% |
| 3-year | -9.80% |
| 5-year | -6.51% |
| YTD | -5.89% |
| 2023 | -14.46% |
| 2022 | -1.83% |
| 2021 | 23.06% |
| 2020 | -9.92% |
| 2019 | 11.86% |
AC Dividends
| Ex-Dividend Date | Type | Payout Amount | Change | ||||||
|---|---|---|---|---|---|---|---|---|---|
| Loading, please wait... | |||||||||
Continue Researching AC
Here are a few links from around the web to help you further your research on Associated Capital Group Inc's stock as an investment opportunity:Associated Capital Group Inc (AC) Stock Price | Nasdaq
Associated Capital Group Inc (AC) Stock Quote, History and News - Yahoo Finance
Associated Capital Group Inc (AC) Stock Price and Basic Information | MarketWatch
Loading social stream, please wait...