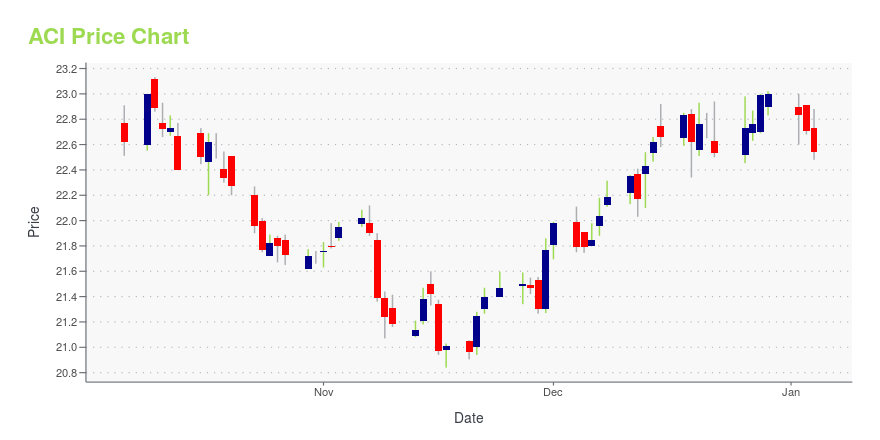
Albertsons Companies, Inc. (ACI): Price and Financial Metrics
ACI Price/Volume Stats
| Current price | $21.23 | 52-week high | $23.20 |
| Prev. close | $21.28 | 52-week low | $17.00 |
| Day low | $21.20 | Volume | 171,375 |
| Day high | $21.33 | Avg. volume | 6,005,159 |
| 50-day MA | $21.78 | Dividend yield | 2.71% |
| 200-day MA | $20.27 | Market Cap | 12.22B |
ACI Stock Price Chart Interactive Chart >
Albertsons Companies, Inc. (ACI) Company Bio
Albertsons Companies, Inc., through its subsidiaries, operates as a food and drug retailer in the United States. Its food and drug retail stores offer grocery products, general merchandise, health and beauty care products, pharmacy, fuel, and other items and services.
ACI Price Returns
| 1-mo | -4.37% |
| 3-mo | -1.14% |
| 6-mo | 8.12% |
| 1-year | 11.03% |
| 3-year | 2.84% |
| 5-year | 103.43% |
| YTD | 9.66% |
| 2024 | -12.54% |
| 2023 | 13.41% |
| 2022 | -6.81% |
| 2021 | 75.18% |
| 2020 | N/A |
ACI Dividends
| Ex-Dividend Date | Type | Payout Amount | Change | ||||||
|---|---|---|---|---|---|---|---|---|---|
| Loading, please wait... | |||||||||


Loading social stream, please wait...