
ACI Worldwide, Inc. (ACIW): Price and Financial Metrics
ACIW Price/Volume Stats
| Current price | $42.99 | 52-week high | $43.59 |
| Prev. close | $42.60 | 52-week low | $19.56 |
| Day low | $42.30 | Volume | 516,000 |
| Day high | $43.59 | Avg. volume | 618,687 |
| 50-day MA | $37.93 | Dividend yield | N/A |
| 200-day MA | $31.52 | Market Cap | 4.53B |
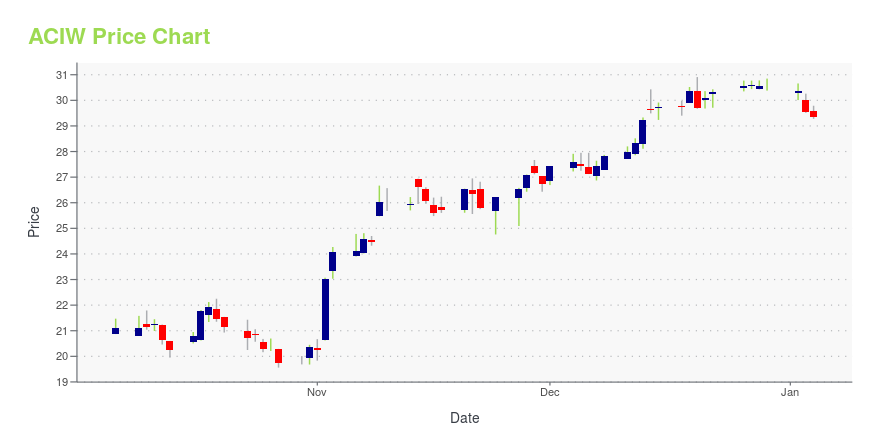
ACIW Stock Price Chart Interactive Chart >
ACI Worldwide, Inc. (ACIW) Company Bio
ACI Worldwide Inc. powers electronic payments and banking for financial institutions, retailers, billers and processors around the world. The company was founded in 1993 and is based in Naples, Florida.
Latest ACIW News From Around the Web
Below are the latest news stories about ACI WORLDWIDE INC that investors may wish to consider to help them evaluate ACIW as an investment opportunity.
ACI Worldwide’s Daniele Astarita Selected To Serve on the EPC Scheme Technical Player Multi-Stakeholder GroupMIAMI, December 18, 2023--ACI Worldwide (NASDAQ: ACIW), a global leader in mission-critical, real-time payments software, today announced that the European Payments Council has selected ACI’s Daniele Astarita, senior principal solution consultant, for a two-year membership to the Scheme Technical Player Multi-Stakeholder Group (STP MSG), beginning January 1, 2024. |
Banco de la República de Colombia and ACI Worldwide Partner to Power Real-Time Payments in ColombiaMIAMI & BOGOTA, Colombia, December 13, 2023--The Central Bank of Colombia, Banco de la República, today announced it is partnering with ACI Worldwide (NASDAQ: ACIW), the global leader in mission-critical, real-time payments software, to build a new domestic real-time payments ecosystem as part of a nationwide banking transformation project. |
ACI Worldwide, Inc.'s (NASDAQ:ACIW) Stock Is Going Strong: Have Financials A Role To Play?ACI Worldwide's (NASDAQ:ACIW) stock is up by a considerable 20% over the past three months. We wonder if and what role... |
Insider Sell: ACI Worldwide Inc's Chief Revenue Officer Alessandro Silva Offloads SharesIn a notable insider transaction, Chief Revenue Officer Alessandro Silva sold 17,817 shares of ACI Worldwide Inc (NASDAQ:ACIW) on December 4, 2023. |
ACI Worldwide Scamscope Report Finds APP Scam Losses Expected To Hit $6.8 Billion by 2027MIAMI, December 05, 2023--Authorized Push Payment (APP) scam losses are on the rise and expected to climb to $6.8 billion — a combined compound annual growth rate (CAGR) of 11% — by 2027 across six leading real-time payment markets (U.S., U.K., India, Brazil, Australia and Saudi Arabia) according to Scamscope, a new report by global payments software company ACI Worldwide and GlobalData, a leading global analytics firm. During the same period, the overall value of real-time transactions is also |
ACIW Price Returns
| 1-mo | 12.95% |
| 3-mo | 29.10% |
| 6-mo | 40.81% |
| 1-year | 88.97% |
| 3-year | 25.44% |
| 5-year | 28.29% |
| YTD | 40.49% |
| 2023 | 33.04% |
| 2022 | -33.72% |
| 2021 | -9.71% |
| 2020 | 1.44% |
| 2019 | 36.92% |
Continue Researching ACIW
Want to see what other sources are saying about Aci Worldwide Inc's financials and stock price? Try the links below:Aci Worldwide Inc (ACIW) Stock Price | Nasdaq
Aci Worldwide Inc (ACIW) Stock Quote, History and News - Yahoo Finance
Aci Worldwide Inc (ACIW) Stock Price and Basic Information | MarketWatch
Loading social stream, please wait...