Acorda Therapeutics, Inc. (ACOR): Price and Financial Metrics
GET POWR RATINGS... FREE!
ACOR POWR Grades
- Value is the dimension where ACOR ranks best; there it ranks ahead of 89.7% of US stocks.
- The strongest trend for ACOR is in Sentiment, which has been heading up over the past 99 days.
- ACOR's current lowest rank is in the Stability metric (where it is better than 11.21% of US stocks).
ACOR Stock Summary
- ACORDA THERAPEUTICS INC's market capitalization of $13,337,057 is ahead of only 5.78% of US-listed equities.
- With a one year PEG ratio of 0.22, ACORDA THERAPEUTICS INC is expected to have a higher PEG ratio (a measure of how expensive a stock is relative to its expected earnings growth) than only 3.12% of US stocks.
- ACOR's price/sales ratio is 0.11; that's higher than the P/S ratio of just 2.77% of US stocks.
- Stocks that are quantitatively similar to ACOR, based on their financial statements, market capitalization, and price volatility, are SLQT, NXTP, HAYW, ACB, and IDXG.
- Visit ACOR's SEC page to see the company's official filings. To visit the company's web site, go to www.acorda.com.
ACOR Valuation Summary
- In comparison to the median Healthcare stock, ACOR's EV/EBIT ratio is 524.24% lower, now standing at -28.
- Over the past 208 months, ACOR's EV/EBIT ratio has gone down 23.9.
Below are key valuation metrics over time for ACOR.
Stock | Date | P/S | P/B | P/E | EV/EBIT |
---|---|---|---|---|---|
ACOR | 2023-03-24 | 0.1 | 0.1 | -0.2 | -28.0 |
ACOR | 2023-03-23 | 0.1 | 0.1 | -0.2 | -28.2 |
ACOR | 2023-03-22 | 0.1 | 0.2 | -0.2 | -28.3 |
ACOR | 2023-03-21 | 0.1 | 0.2 | -0.2 | -28.4 |
ACOR | 2023-03-20 | 0.1 | 0.2 | -0.2 | -28.4 |
ACOR | 2023-03-17 | 0.1 | 0.2 | -0.2 | -28.5 |
ACOR Growth Metrics
- The 2 year price growth rate now stands at -84.38%.
- Its year over year net income to common stockholders growth rate is now at 24.93%.
- Its 4 year net income to common stockholders growth rate is now at -337.4%.

The table below shows ACOR's growth in key financial areas (numbers in millions of US dollars).
Date | Revenue | Operating Cash Flow | Net Income to Common Stock |
---|---|---|---|
2022-09-30 | 124.063 | -26.75 | -105.625 |
2022-06-30 | 122.008 | -33.923 | -118.842 |
2022-03-31 | 122.742 | -28.097 | -95.024 |
2021-12-31 | 129.071 | -41.348 | -103.954 |
2021-09-30 | 130.263 | -43.14 | -166.434 |
2021-06-30 | 151.897 | -37.033 | -132.016 |
ACOR's Quality Factors
The “Quality” component of the POWR Ratings focuses on 31 different factors of a companies fundamentals and operational strength. Here are some key insights as we drill into the specifics of these quality attributes.- ACOR has a Quality Grade of C, ranking ahead of 72.56% of graded US stocks.
- ACOR's asset turnover comes in at 0.251 -- ranking 176th of 680 Pharmaceutical Products stocks.
- BDSI, INVA, and CALA are the stocks whose asset turnover ratios are most correlated with ACOR.
The table below shows ACOR's key quality metrics over time.
Period | Asset Turnover | Gross Margin | ROIC |
---|---|---|---|
2021-06-30 | 0.251 | 0.695 | -0.414 |
2021-03-31 | 0.232 | 0.729 | -0.327 |
2020-12-31 | 0.217 | 0.781 | -0.207 |
2020-09-30 | 0.221 | 0.810 | 0.173 |
2020-06-30 | 0.202 | 0.830 | -0.419 |
2020-03-31 | 0.194 | 0.831 | -0.393 |
ACOR Price Target
For more insight on analysts targets of ACOR, see our ACOR price target page. And for a list of of all stocks sorted by upside potential based on analyst target price, see our Top Price Target page.
Average Price Target | $10.00 | Average Broker Recommendation | 1.5 (Moderate Buy) |
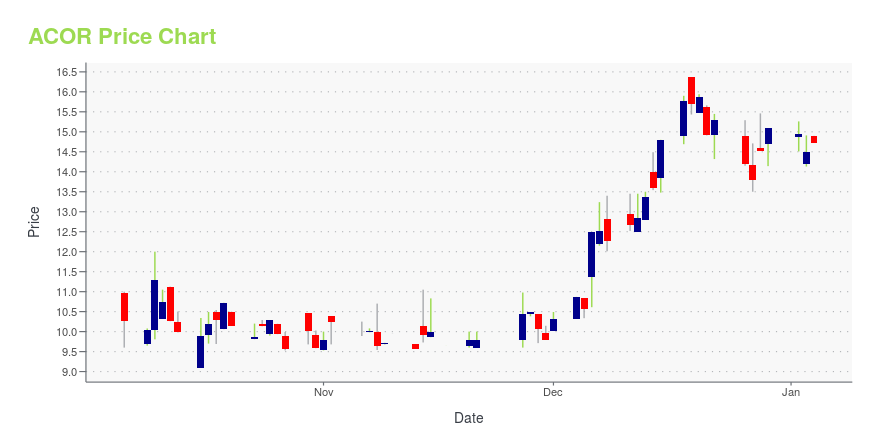
ACOR Stock Price Chart Interactive Chart >
ACOR Price/Volume Stats
Current price | $0.60 | 52-week high | $1.74 |
Prev. close | $0.58 | 52-week low | $0.26 |
Day low | $0.56 | Volume | 138,700 |
Day high | $0.63 | Avg. volume | 202,613 |
50-day MA | $0.84 | Dividend yield | N/A |
200-day MA | $0.60 | Market Cap | 14.60M |
Acorda Therapeutics, Inc. (ACOR) Company Bio
Acorda Therapeutics is a biotechnology company focused on developing therapies that restore function and improve the lives of people with neurological disorders. The company was founded in 1995 and is based in Ardsley, New York.
Latest ACOR News From Around the Web
Below are the latest news stories about ACORDA THERAPEUTICS INC that investors may wish to consider to help them evaluate ACOR as an investment opportunity.
Acorda Therapeutics CEO Ron Cohen, M.D., to Hold Virtual Company Presentation and Q&APEARL RIVER, N.Y., March 27, 2023--Acorda Therapeutics CEO Ron Cohen, M.D., to Hold Virtual Company Presentation and Q&A |
Acorda Therapeutics Reports Fourth Quarter and Full Year 2022 Financial ResultsPEARL RIVER, N.Y., March 09, 2023--Acorda Therapeutics Reports Fourth Quarter and Full Year 2022 Financial Results |
ESTEVE Launches INBRIJA® in SpainPEARL RIVER, N.Y., March 07, 2023--ESTEVE Launches INBRIJA® in Spain |
Acorda Fourth Quarter/Year End 2022 Update: Webcast/Conference Call Scheduled for March 9, 2023PEARL RIVER, N.Y., March 06, 2023--Acorda Fourth Quarter/Year End 2022 Update: Webcast/Conference Call Scheduled for March 9, 2023 |
Acorda Therapeutics Receives Nasdaq Extension to Meet Minimum Bid Price RequirementPEARL RIVER, N.Y., February 14, 2023--Acorda Therapeutics Receives Nasdaq Extension to Meet Minimum Bid Price Requirement |
ACOR Price Returns
1-mo | -33.59% |
3-mo | -21.74% |
6-mo | 100.67% |
1-year | -64.29% |
3-year | -89.84% |
5-year | -99.58% |
YTD | -21.74% |
2022 | -67.92% |
2021 | -42.28% |
2020 | -66.17% |
2019 | -86.91% |
2018 | -27.37% |
Continue Researching ACOR
Here are a few links from around the web to help you further your research on Acorda Therapeutics Inc's stock as an investment opportunity:Acorda Therapeutics Inc (ACOR) Stock Price | Nasdaq
Acorda Therapeutics Inc (ACOR) Stock Quote, History and News - Yahoo Finance
Acorda Therapeutics Inc (ACOR) Stock Price and Basic Information | MarketWatch
Loading social stream, please wait...