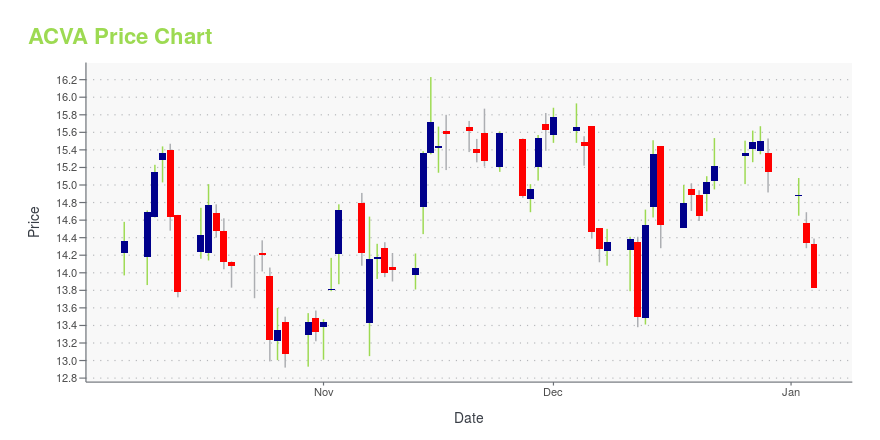
ACV Auctions Inc. (ACVA): Price and Financial Metrics
ACVA Price/Volume Stats
| Current price | $17.62 | 52-week high | $19.63 |
| Prev. close | $17.47 | 52-week low | $12.84 |
| Day low | $17.35 | Volume | 1,066,881 |
| Day high | $17.88 | Avg. volume | 1,144,888 |
| 50-day MA | $18.08 | Dividend yield | N/A |
| 200-day MA | $16.32 | Market Cap | 2.91B |
ACVA Stock Price Chart Interactive Chart >
ACV Auctions Inc. (ACVA) Company Bio
ACV Auctions, Inc., operates a digital marketplace that connects buyers and sellers for the online auction of wholesale vehicles. It also provides data services that offer transparent and accurate vehicle information to customers. ACV Auctions, Inc. was incorporated in 2014 and is based in Buffalo, New York.
Latest ACVA News From Around the Web
Below are the latest news stories about ACV AUCTIONS INC that investors may wish to consider to help them evaluate ACVA as an investment opportunity.
Insider Sell: CEO George Chamoun Sells 443,776 Shares of ACV Auctions Inc (ACVA)ACV Auctions Inc (NASDAQ:ACVA) has recently witnessed a significant insider sell by its CEO, George Chamoun. |
Insider Sell: CFO William Zerella Sells 17,500 Shares of ACV Auctions Inc (ACVA)In a notable insider transaction, CFO William Zerella of ACV Auctions Inc (NASDAQ:ACVA) sold 17,500 shares of the company's stock on December 12, 2023. |
Is ACV Auctions (ACVA) Outperforming Other Retail-Wholesale Stocks This Year?Here is how ACV Auctions Inc. (ACVA) and American Eagle Outfitters (AEO) have performed compared to their sector so far this year. |
Analysts Expect Breakeven For ACV Auctions Inc. (NASDAQ:ACVA) Before LongWith the business potentially at an important milestone, we thought we'd take a closer look at ACV Auctions Inc.'s... |
Are Retail-Wholesale Stocks Lagging ACV Auctions (ACVA) This Year?Here is how ACV Auctions Inc. (ACVA) and American Eagle Outfitters (AEO) have performed compared to their sector so far this year. |
ACVA Price Returns
| 1-mo | -2.17% |
| 3-mo | -2.60% |
| 6-mo | 31.00% |
| 1-year | 9.03% |
| 3-year | -22.96% |
| 5-year | N/A |
| YTD | 16.30% |
| 2023 | 84.53% |
| 2022 | -56.42% |
| 2021 | N/A |
| 2020 | N/A |
| 2019 | N/A |


Loading social stream, please wait...