Archer Daniels Midland Co. (ADM): Price and Financial Metrics
ADM Price/Volume Stats
Current price | $71.89 | 52-week high | $98.28 |
Prev. close | $71.97 | 52-week low | $69.92 |
Day low | $71.49 | Volume | 810,691 |
Day high | $72.25 | Avg. volume | 3,103,618 |
50-day MA | $76.78 | Dividend yield | 2.55% |
200-day MA | $84.64 | Market Cap | 39.15B |
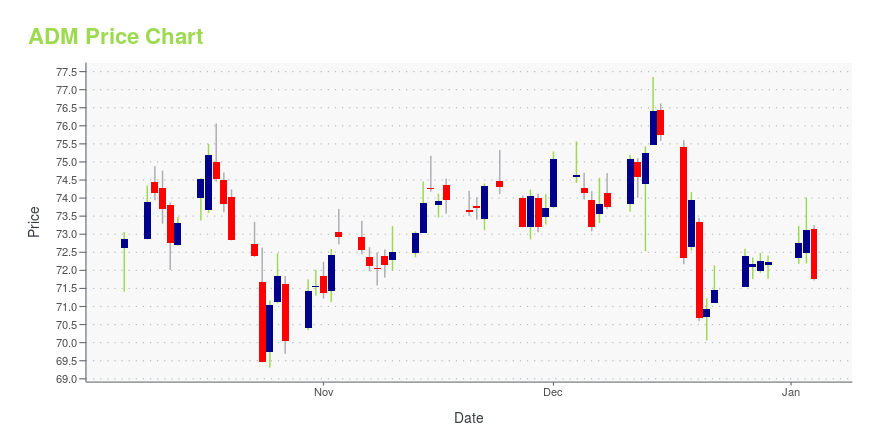
ADM Stock Price Chart Interactive Chart >
ADM POWR Grades
- ADM scores best on the Stability dimension, with a Stability rank ahead of 68.98% of US stocks.
- ADM's strongest trending metric is Momentum; it's been moving down over the last 179 days.
- ADM's current lowest rank is in the Momentum metric (where it is better than 0.69% of US stocks).
ADM Stock Summary
- With a market capitalization of $39,676,646,418, ARCHER-DANIELS-MIDLAND CO has a greater market value than 94.43% of US stocks.
- ARCHER-DANIELS-MIDLAND CO's capital turnover -- a measure of revenue relative to shareholder's equity -- is better than 87.78% of US listed stocks.
- ADM's went public 37.42 years ago, making it older than 93.61% of listed US stocks we're tracking.
- Stocks with similar financial metrics, market capitalization, and price volatility to ARCHER-DANIELS-MIDLAND CO are TT, CRH, KDP, NUE, and ROST.
- ADM's SEC filings can be seen here. And to visit ARCHER-DANIELS-MIDLAND CO's official web site, go to www.adm.com.
ADM Valuation Summary
- In comparison to the median Consumer Defensive stock, ADM's EV/EBIT ratio is 52.53% lower, now standing at 8.9.
- ADM's price/sales ratio has moved up 0.1 over the prior 243 months.
Below are key valuation metrics over time for ADM.
Stock | Date | P/S | P/B | P/E | EV/EBIT |
---|---|---|---|---|---|
ADM | 2023-05-23 | 0.4 | 1.6 | 9.2 | 8.9 |
ADM | 2023-05-22 | 0.4 | 1.6 | 9.0 | 8.7 |
ADM | 2023-05-19 | 0.4 | 1.6 | 9.0 | 8.7 |
ADM | 2023-05-18 | 0.4 | 1.6 | 8.9 | 8.7 |
ADM | 2023-05-17 | 0.4 | 1.6 | 8.9 | 8.7 |
ADM | 2023-05-16 | 0.4 | 1.6 | 8.9 | 8.7 |
ADM Growth Metrics
- The 5 year cash and equivalents growth rate now stands at 894.54%.
- Its 5 year revenue growth rate is now at 2.18%.
- Its 4 year net income to common stockholders growth rate is now at 10.73%.

The table below shows ADM's growth in key financial areas (numbers in millions of US dollars).
Date | Revenue | Operating Cash Flow | Net Income to Common Stock |
---|---|---|---|
2022-12-31 | 101,556 | 3,478 | 4,340 |
2022-09-30 | 98,707 | 4,090 | 4,103 |
2022-06-30 | 94,364 | 2,913 | 3,598 |
2022-03-31 | 90,006 | 5,091 | 3,074 |
2021-12-31 | 85,249 | 6,595 | 2,709 |
2021-09-30 | 80,137 | 4,983 | 2,614 |
ADM's Quality Factors
The “Quality” component of the POWR Ratings focuses on 31 different factors of a companies fundamentals and operational strength. Here are some key insights as we drill into the specifics of these quality attributes.- ADM has a Quality Grade of C, ranking ahead of 68% of graded US stocks.
- ADM's asset turnover comes in at 1.568 -- ranking 11th of 59 Food Products stocks.
- PPC, RMCF, and DAR are the stocks whose asset turnover ratios are most correlated with ADM.
The table below shows ADM's key quality metrics over time.
Period | Asset Turnover | Gross Margin | ROIC |
---|---|---|---|
2021-09-30 | 1.568 | 0.071 | 0.087 |
2021-06-30 | 1.522 | 0.072 | 0.079 |
2021-03-31 | 1.435 | 0.074 | 0.074 |
2020-12-31 | 1.375 | 0.069 | 0.064 |
2020-09-30 | 1.382 | 0.068 | 0.060 |
2020-06-30 | 1.441 | 0.067 | 0.069 |
ADM Price Target
For more insight on analysts targets of ADM, see our ADM price target page. And for a list of of all stocks sorted by upside potential based on analyst target price, see our Top Price Target page.
Average Price Target | $67.54 | Average Broker Recommendation | 1.47 (Moderate Buy) |
Archer Daniels Midland Co. (ADM) Company Bio
The Archer-Daniels-Midland Company, commonly known as ADM, is an American multinational food processing and commodities trading corporation founded in 1902 and headquartered in Chicago, Illinois. The company operates more than 270 plants and 420 crop procurement facilities worldwide, where cereal grains and oilseeds are processed into products used in food, beverage, nutraceutical, industrial, and animal feed markets worldwide. (Source:Wikipedia)
Latest ADM News From Around the Web
Below are the latest news stories about ARCHER-DANIELS-MIDLAND CO that investors may wish to consider to help them evaluate ADM as an investment opportunity.
Does Archer-Daniels-Midland (NYSE:ADM) Deserve A Spot On Your Watchlist?The excitement of investing in a company that can reverse its fortunes is a big draw for some speculators, so even... |
Archer Daniels Midland (ADM) Dips More Than Broader Markets: What You Should KnowIn the latest trading session, Archer Daniels Midland (ADM) closed at $70.65, marking a -1.09% move from the previous day. |
Bunge, Viterra merger would create global agriculture trading giantA merger of U.S. grains merchant Bunge Ltd with rival Viterra would grow the combined entity's businesses in the U.S., Brazil and Australia and may raise competition concerns in parts of Canada and Argentina, where key oilseed processing assets overlap, analysts said. Sources last week said Bunge and Glencore Plc-owned Viterra were in talks for a potential mega deal that would further consolidate global agriculture trading and bring Bunge closer in global scale to leading rivals Archer-Daniels-Midland Co and Cargill Inc. |
Brazil makes rare soybean sales to U.S. - shipping dataBrazil is exporting a combined 120,000 tonnes of soybeans to buyers in the United States, shipping data seen by Reuters showed, as the price of the oilseed in the world's largest soybean supplier is a bargain even for importers in the No. 2 producing nation. According to data from Williams, a shipping agency, dated May 26, three vessels loaded with the Brazilian soybeans will leave ports in the north of the South American nation between June 4 and June 11. The purchases reflect Brazil's glowing clout as an agriculture exporter. |
Archer Daniels Midland Company (ADM) Is a Trending Stock: Facts to Know Before Betting on ItZacks.com users have recently been watching ADM (ADM) quite a bit. Thus, it is worth knowing the facts that could determine the stock's prospects. |
ADM Price Returns
1-mo | -4.79% |
3-mo | -9.30% |
6-mo | -21.96% |
1-year | -16.55% |
3-year | 81.23% |
5-year | 83.89% |
YTD | -21.69% |
2022 | 39.98% |
2021 | 37.33% |
2020 | 12.44% |
2019 | 17.10% |
2018 | 5.28% |
ADM Dividends
Ex-Dividend Date | Type | Payout Amount | Change | ||||||
---|---|---|---|---|---|---|---|---|---|
Loading, please wait... |
Continue Researching ADM
Here are a few links from around the web to help you further your research on Archer-Daniels-Midland Co's stock as an investment opportunity:Archer-Daniels-Midland Co (ADM) Stock Price | Nasdaq
Archer-Daniels-Midland Co (ADM) Stock Quote, History and News - Yahoo Finance
Archer-Daniels-Midland Co (ADM) Stock Price and Basic Information | MarketWatch
Loading social stream, please wait...