AES Corp. (AES): Price and Financial Metrics
GET POWR RATINGS... FREE!
AES POWR Grades
- Momentum is the dimension where AES ranks best; there it ranks ahead of 75.59% of US stocks.
- AES's strongest trending metric is Momentum; it's been moving up over the last 179 days.
- AES's current lowest rank is in the Quality metric (where it is better than 25.36% of US stocks).
AES Stock Summary
- Of note is the ratio of Aes Corp's sales and general administrative expense to its total operating expenses; merely 3.57% of US stocks have a lower such ratio.
- For AES, its debt to operating expenses ratio is greater than that reported by 91.28% of US equities we're observing.
- Equity multiplier, or assets relative to shareholders' equity, comes in at 10.67 for Aes Corp; that's greater than it is for 92.87% of US stocks.
- Stocks with similar financial metrics, market capitalization, and price volatility to Aes Corp are CMS, LNT, CNP, NNN, and OKE.
- AES's SEC filings can be seen here. And to visit Aes Corp's official web site, go to www.aes.com.
AES Valuation Summary
- AES's EV/EBIT ratio is 40.9; this is 80.18% higher than that of the median Utilities stock.
- AES's price/sales ratio has moved down 0.4 over the prior 243 months.
Below are key valuation metrics over time for AES.
Stock | Date | P/S | P/B | P/E | EV/EBIT |
---|---|---|---|---|---|
AES | 2021-09-01 | 1.5 | 4.9 | -119.1 | 40.9 |
AES | 2021-08-31 | 1.5 | 4.9 | -117.8 | 40.7 |
AES | 2021-08-30 | 1.5 | 4.9 | -119.0 | 40.9 |
AES | 2021-08-27 | 1.5 | 4.9 | -119.4 | 41.0 |
AES | 2021-08-26 | 1.5 | 4.9 | -117.8 | 40.7 |
AES | 2021-08-25 | 1.5 | 5.0 | -119.7 | 41.0 |
AES Growth Metrics
- Its 4 year net income to common stockholders growth rate is now at 1.03%.
- Its year over year net income to common stockholders growth rate is now at -183.96%.
- Its 3 year net income to common stockholders growth rate is now at 132.07%.

The table below shows AES's growth in key financial areas (numbers in millions of US dollars).
Date | Revenue | Operating Cash Flow | Net Income to Common Stock |
---|---|---|---|
2021-12-31 | 11,141 | 1,902 | -409 |
2021-09-30 | 10,931 | 2,047 | 541 |
2021-06-30 | 10,440 | 2,539 | -135 |
2021-03-31 | 9,957 | 2,635 | -246 |
2020-12-31 | 9,660 | 2,755 | 46 |
2020-09-30 | 9,531 | 2,778 | -350 |
AES's Quality Factors
The “Quality” component of the POWR Ratings focuses on 31 different factors of a companies fundamentals and operational strength. Here are some key insights as we drill into the specifics of these quality attributes.- AES has a Quality Grade of D, ranking ahead of 24.86% of graded US stocks.
- AES's asset turnover comes in at 0.301 -- ranking 14th of 14 Almost Nothing stocks.
- CVA, PESI, and SRCL are the stocks whose asset turnover ratios are most correlated with AES.
The table below shows AES's key quality metrics over time.
Period | Asset Turnover | Gross Margin | ROIC |
---|---|---|---|
2021-06-30 | 0.301 | 0.293 | 0.018 |
2021-03-31 | 0.287 | 0.286 | 0.019 |
2020-12-31 | 0.281 | 0.279 | 0.028 |
2020-09-30 | 0.279 | 0.246 | 0.016 |
2020-06-30 | 0.283 | 0.238 | 0.033 |
2020-03-31 | 0.294 | 0.230 | 0.036 |
AES Price Target
For more insight on analysts targets of AES, see our AES price target page. And for a list of of all stocks sorted by upside potential based on analyst target price, see our Top Price Target page.
Average Price Target | $30.06 | Average Broker Recommendation | 1.35 (Strong Buy) |
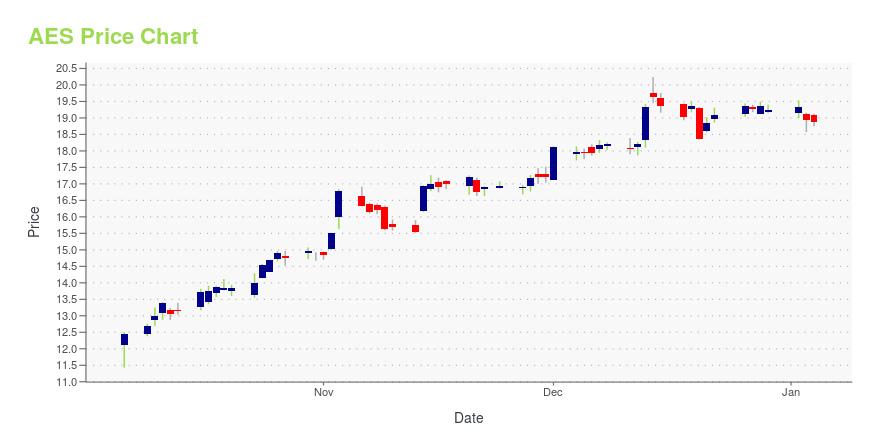
AES Stock Price Chart Interactive Chart >
AES Price/Volume Stats
Current price | $20.74 | 52-week high | $26.52 |
Prev. close | $21.48 | 52-week low | $18.62 |
Day low | $20.61 | Volume | 1,777,276 |
Day high | $21.17 | Avg. volume | 5,982,194 |
50-day MA | $20.94 | Dividend yield | 2.93% |
200-day MA | $22.94 | Market Cap | 13.85B |
AES Corp. (AES) Company Bio
AES Corp. engages in the provision of power generation and utility services through its renewable and thermal generation facilities and distribution businesses. It operates through the following segments: U.S. and Utilities Strategic Business Unit (SBU), South America SBU, MCAC SBU, Eurasia SBU and Corporate and Other. The U.S. and Utilities SBU segment consists of facilities in the United States, Puerto Rico and El Salvador. The South America SBU segment covers Chile, Colombia, Argentina, and Brazil. The MCAC SBU segment refers to Mexico, Central America, and the Caribbean. The Eurasia SBU segment handles operations in Europe and Asia. The Corporate and Other segment includes the results of the AES self-insurance company. The company was founded by Dennis W. Bakke and Roger W. Sant in 1981 and is headquartered in Arlington, VA.
Latest AES News From Around the Web
Below are the latest news stories about Aes Corp that investors may wish to consider to help them evaluate AES as an investment opportunity.
AES posts Q4 earnings beat, intends to exit coal by 2025AES Corp. (AES -0.6%) shares edge lower after beating expectations for Q4 earnings and revenues, and announcing plans to exit coal by 2025 through a combination of asset sales, fuel conversions and retirements. AES also issues in-line guidance for FY 2022, seeing adjusted EPS of $1.55-$1.65, vs. $1.63 analyst consensus estimate,... |
AES declares $0.158 dividendAES (NYSE:AES) declares $0.158/share quarterly dividend, in line with previous. Forward yield 3.0% Payable May 13; for shareholders of record April 29; ex-div April 28. See AES Dividend Scorecard, Yield Chart, & Dividend Growth.... |
AES Announces Quarterly DividendThe Board of Directors of The AES Corporation (NYSE: AES) declared a quarterly common stock dividend of $0.1580 per share payable on May 13, 2022 to shareholders of record at the close of business on April 29, 2022. |
AES Q4 Earnings Surpass Estimates, Revenues Increase Y/YAES Corp.'s (AES) Q4 revenues come in at $2,770 million in the reported quarter, up 8.2% year over year. |
AES (AES) Q4 Earnings and Revenues Surpass EstimatesAES (AES) delivered earnings and revenue surprises of 4.65% and 9.48%, respectively, for the quarter ended December 2021. Do the numbers hold clues to what lies ahead for the stock? |
AES Price Returns
1-mo | -6.87% |
3-mo | -17.99% |
6-mo | -9.44% |
1-year | N/A |
3-year | 32.37% |
5-year | 129.59% |
YTD | -13.39% |
2021 | 5.93% |
2020 | 22.15% |
2019 | 42.16% |
2018 | 39.02% |
2017 | -2.69% |
AES Dividends
Ex-Dividend Date | Type | Payout Amount | Change | ||||||
---|---|---|---|---|---|---|---|---|---|
Loading, please wait... |
Continue Researching AES
Want to see what other sources are saying about Aes Corp's financials and stock price? Try the links below:Aes Corp (AES) Stock Price | Nasdaq
Aes Corp (AES) Stock Quote, History and News - Yahoo Finance
Aes Corp (AES) Stock Price and Basic Information | MarketWatch
Loading social stream, please wait...