Armstrong Flooring, Inc. (AFI): Price and Financial Metrics
GET POWR RATINGS... FREE!
AFI POWR Grades
- Sentiment is the dimension where AFI ranks best; there it ranks ahead of 76.33% of US stocks.
- The strongest trend for AFI is in Sentiment, which has been heading up over the past 179 days.
- AFI's current lowest rank is in the Quality metric (where it is better than 14.23% of US stocks).
AFI Stock Summary
- With a price/sales ratio of 0.05, Armstrong Flooring Inc has a higher such ratio than merely 0.26% of stocks in our set.
- In terms of volatility of its share price, AFI is more volatile than 95.72% of stocks we're observing.
- Shareholder yield, a measure of how much is returned to shareholders via dividends and share repurchases, for AFI comes in at -77.03% -- higher than that of only 5.32% of stocks in our set.
- Stocks with similar financial metrics, market capitalization, and price volatility to Armstrong Flooring Inc are PFMT, TILE, VINP, OCC, and LCUT.
- AFI's SEC filings can be seen here. And to visit Armstrong Flooring Inc's official web site, go to www.armstrongflooring.com.
AFI Valuation Summary
- In comparison to the median Basic Materials stock, AFI's price/earnings ratio is 110.55% lower, now standing at -2.1.
- AFI's price/sales ratio has moved down 0.2 over the prior 66 months.
Below are key valuation metrics over time for AFI.
Stock | Date | P/S | P/B | P/E | EV/EBIT |
---|---|---|---|---|---|
AFI | 2021-09-03 | 0.1 | 0.3 | -2.1 | -5.6 |
AFI | 2021-09-02 | 0.1 | 0.3 | -2.1 | -5.7 |
AFI | 2021-09-01 | 0.1 | 0.3 | -2.1 | -5.6 |
AFI | 2021-08-31 | 0.1 | 0.3 | -2.1 | -5.6 |
AFI | 2021-08-30 | 0.1 | 0.3 | -2.1 | -5.7 |
AFI | 2021-08-27 | 0.1 | 0.3 | -2.2 | -5.8 |
AFI's Quality Factors
The “Quality” component of the POWR Ratings focuses on 31 different factors of a companies fundamentals and operational strength. Here are some key insights as we drill into the specifics of these quality attributes.- AFI has a Quality Grade of D, ranking ahead of 16.81% of graded US stocks.
- AFI's asset turnover comes in at 1.238 -- ranking 5th of 22 Rubber and Plastic Products stocks.
- FORD, ENTG, and CMT are the stocks whose asset turnover ratios are most correlated with AFI.
The table below shows AFI's key quality metrics over time.
Period | Asset Turnover | Gross Margin | ROIC |
---|---|---|---|
2021-06-30 | 1.238 | 0.124 | -0.060 |
2021-03-31 | 1.184 | 0.135 | -0.034 |
2020-12-31 | 1.153 | 0.143 | -0.135 |
2020-09-30 | 1.143 | 0.156 | -0.110 |
2020-06-30 | 1.135 | 0.127 | -0.163 |
2020-03-31 | 1.150 | 0.139 | -0.114 |
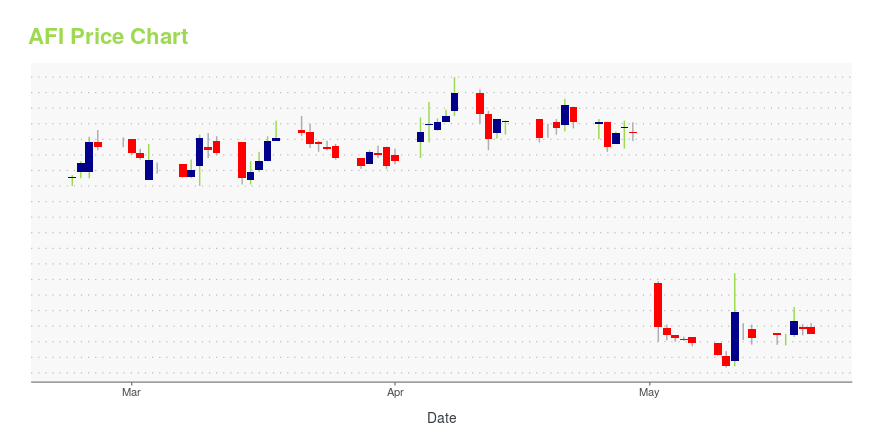
AFI Stock Price Chart Interactive Chart >
AFI Price/Volume Stats
Current price | $0.35 | 52-week high | $6.62 |
Prev. close | $0.38 | 52-week low | $0.13 |
Day low | $0.35 | Volume | 2,996,000 |
Day high | $0.42 | Avg. volume | 3,328,503 |
50-day MA | $1.23 | Dividend yield | N/A |
200-day MA | $2.18 | Market Cap | 7.65M |
Armstrong Flooring, Inc. (AFI) Company Bio
Armstrong Flooring, Inc. designs, manufactures and sells flooring products in North American and Asian markets. The company was founded in 1891 and is based in Lancaster, Pennsylvania.
Latest AFI News From Around the Web
Below are the latest news stories about Armstrong Flooring Inc that investors may wish to consider to help them evaluate AFI as an investment opportunity.
Armstrong Flooring Announces Price IncreasesVarious price increases will go into effect on March 1, 2022LANCASTER, Pa., Jan. 14, 2022 (GLOBE NEWSWIRE) -- Armstrong Flooring announced it will increase U.S. prices effective March 1, 2022 to offset rising input costs. For select Residential products, price increases will range from 0-10%. For select Commercial products, price increases will range from 0-15%. The previously announced and implemented ocean and freight surcharges will remain in place. “Armstrong Flooring continues its strong co |
3 Deep Value Moonshots to Ride Out Powell’s Taper TantrumThese three companies might seem like zombies compared to other investing opportunities, but they'll be robust during the Fed taper. |
Today’s Biggest Pre-Market Stock Movers: 10 Top Gainers and Losers on TuesdayGood morning, trader! |
Armstrong 'Floors' Investors, Gains 35%150-year-old flooring company increases debt capacity to pursue growth |
AFI Stock Alert: 7 Things to Know About the Rumors Lifting Armstrong FlooringAfter a tumultuous 2021, Armstrong Flooring announced that it had put itself up for sale today. |
AFI Price Returns
1-mo | N/A |
3-mo | -76.03% |
6-mo | -82.32% |
1-year | -94.35% |
3-year | -96.50% |
5-year | -98.05% |
YTD | -82.32% |
2021 | -48.17% |
2020 | -10.54% |
2019 | -63.94% |
2018 | -30.02% |
2017 | -15.02% |
Continue Researching AFI
Want to do more research on Armstrong Flooring Inc's stock and its price? Try the links below:Armstrong Flooring Inc (AFI) Stock Price | Nasdaq
Armstrong Flooring Inc (AFI) Stock Quote, History and News - Yahoo Finance
Armstrong Flooring Inc (AFI) Stock Price and Basic Information | MarketWatch
Loading social stream, please wait...