Agenus Inc. (AGEN): Price and Financial Metrics
AGEN Price/Volume Stats
Current price | $0.70 | 52-week high | $3.07 |
Prev. close | $0.66 | 52-week low | $0.61 |
Day low | $0.63 | Volume | 19,825,500 |
Day high | $0.72 | Avg. volume | 5,264,368 |
50-day MA | $0.91 | Dividend yield | N/A |
200-day MA | $1.43 | Market Cap | 267.05M |
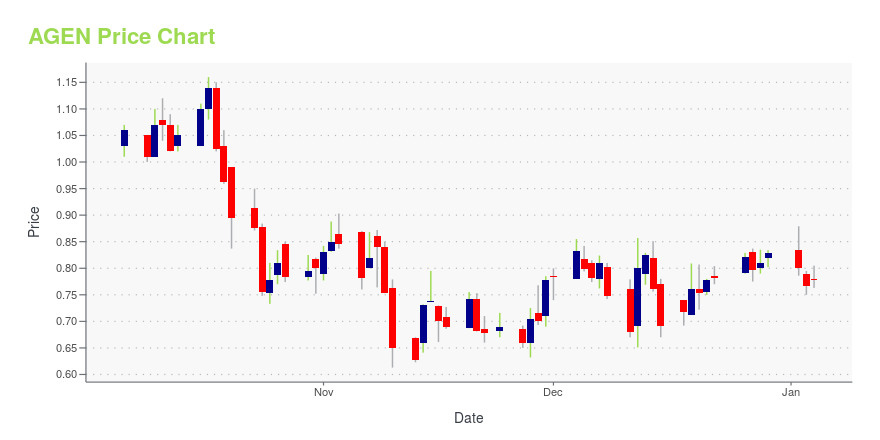
AGEN Stock Price Chart Interactive Chart >
AGEN POWR Grades
- AGEN scores best on the Growth dimension, with a Growth rank ahead of 68.17% of US stocks.
- AGEN's strongest trending metric is Momentum; it's been moving down over the last 177 days.
- AGEN ranks lowest in Momentum; there it ranks in the 4th percentile.
AGEN Stock Summary
- AGENUS INC's capital turnover -- a measure of revenue relative to shareholder's equity -- is better than merely 5.73% of US listed stocks.
- Equity multiplier, or assets relative to shareholders' equity, comes in at -4.52 for AGENUS INC; that's greater than it is for just 3.59% of US stocks.
- Shareholder yield, a measure of how much is returned to shareholders via dividends and share repurchases, for AGEN comes in at -55.2% -- higher than that of merely 9.84% of stocks in our set.
- Stocks with similar financial metrics, market capitalization, and price volatility to AGENUS INC are CTMX, VTGN, EIGR, CRBU, and DBVT.
- Visit AGEN's SEC page to see the company's official filings. To visit the company's web site, go to agenusbio.com.
AGEN Valuation Summary
- AGEN's price/earnings ratio is -1.2; this is 104.94% lower than that of the median Healthcare stock.
- Over the past 243 months, AGEN's price/sales ratio has gone down 80.8.
Below are key valuation metrics over time for AGEN.
Stock | Date | P/S | P/B | P/E | EV/EBIT |
---|---|---|---|---|---|
AGEN | 2023-11-03 | 3.2 | -3.4 | -1.2 | -1.3 |
AGEN | 2023-11-02 | 3.2 | -3.5 | -1.2 | -1.3 |
AGEN | 2023-11-01 | 3.2 | -3.4 | -1.2 | -1.3 |
AGEN | 2023-10-31 | 3.1 | -3.3 | -1.2 | -1.2 |
AGEN | 2023-10-30 | 3.0 | -3.2 | -1.1 | -1.2 |
AGEN | 2023-10-27 | 3.0 | -3.2 | -1.1 | -1.2 |
AGEN Growth Metrics
- Its 5 year net income to common stockholders growth rate is now at -52.01%.
- Its year over year revenue growth rate is now at 265.6%.
- The 2 year price growth rate now stands at -36.88%.

The table below shows AGEN's growth in key financial areas (numbers in millions of US dollars).
Date | Revenue | Operating Cash Flow | Net Income to Common Stock |
---|---|---|---|
2022-09-30 | 89.9 | -150.962 | -214.704 |
2022-06-30 | 320.082 | 12.602 | 18.07 |
2022-03-31 | 309.886 | 0.498 | -18.786 |
2021-12-31 | 295.665 | 10.145 | -24.137 |
2021-09-30 | 306.667 | -2.518 | 3.767 |
2021-06-30 | 68.545 | -165.517 | -225.937 |
AGEN's Quality Factors
The “Quality” component of the POWR Ratings focuses on 31 different factors of a companies fundamentals and operational strength. Here are some key insights as we drill into the specifics of these quality attributes.- AGEN has a Quality Grade of C, ranking ahead of 55.26% of graded US stocks.
- AGEN's asset turnover comes in at 0.324 -- ranking 139th of 681 Pharmaceutical Products stocks.
- COCP, MTEM, and LGND are the stocks whose asset turnover ratios are most correlated with AGEN.
The table below shows AGEN's key quality metrics over time.
Period | Asset Turnover | Gross Margin | ROIC |
---|---|---|---|
2021-06-30 | 0.324 | 0.949 | 8.194 |
2021-03-31 | 0.404 | 0.959 | 5.948 |
2020-12-31 | 0.449 | 0.973 | 3.708 |
2020-09-30 | 0.504 | 0.983 | 2.706 |
2020-06-30 | 0.555 | 0.993 | 2.612 |
2020-03-30 | 0.476 | 1.000 | 2.580 |
AGEN Price Target
For more insight on analysts targets of AGEN, see our AGEN price target page. And for a list of of all stocks sorted by upside potential based on analyst target price, see our Top Price Target page.
Average Price Target | $10.00 | Average Broker Recommendation | 1.17 (Strong Buy) |
Agenus Inc. (AGEN) Company Bio
Agenus Inc. engages in discovering and developing innovative treatments for patients with cancer and other diseases. The company was founded in 1994 and is based in Lexington, Massachusetts.
Latest AGEN News From Around the Web
Below are the latest news stories about AGENUS INC that investors may wish to consider to help them evaluate AGEN as an investment opportunity.
Avita (RCEL) Falls 19% on Lowered 2023 Revenue GuidanceAvita's (RCEL) stock declines 19% after the company lowered its total revenue guidance for 2023. |
Repare Therapeutics (RPTX) Rises 34% in a Week: Here's WhyRepare Therapeutics (RPTX) rises 34% in a week after announcing plans to begin clinal-stage development of two additional candidates, RP-1664 and RP-3467, in 2024 in several solid tumor indications. |
Rainbows and Unicorns: Agenus Inc. (NASDAQ:AGEN) Analysts Just Became A Lot More OptimisticAgenus Inc. ( NASDAQ:AGEN ) shareholders will have a reason to smile today, with the analysts making substantial... |
Agenus Inc (AGEN) Reports Q3 2023 Results: Revenue of $24.3 Million and Net Loss of $64.5 MillionKey Highlights Include Promising Clinical Data and Anticipated Regulatory Filings |
Agenus Reports Third Quarter 2023 ResultsLEXINGTON, Mass., November 07, 2023--Agenus Inc. ("Agenus") (Nasdaq: AGEN), a leader in discovering and developing novel immunological agents to treat various cancers, today announced results for the third quarter 2023. Agenus executives will host a conference call and webcast at 9:00 a.m. ET to discuss the results and to provide a corporate update. |
AGEN Price Returns
1-mo | -11.92% |
3-mo | -49.28% |
6-mo | -56.25% |
1-year | -73.38% |
3-year | -81.13% |
5-year | -70.95% |
YTD | -70.83% |
2022 | -25.47% |
2021 | 1.26% |
2020 | -21.87% |
2019 | 71.01% |
2018 | -26.99% |
Continue Researching AGEN
Here are a few links from around the web to help you further your research on Agenus Inc's stock as an investment opportunity:Agenus Inc (AGEN) Stock Price | Nasdaq
Agenus Inc (AGEN) Stock Quote, History and News - Yahoo Finance
Agenus Inc (AGEN) Stock Price and Basic Information | MarketWatch
Loading social stream, please wait...