
Aeglea BioTherapeutics, Inc. (AGLE): Price and Financial Metrics
AGLE Price/Volume Stats
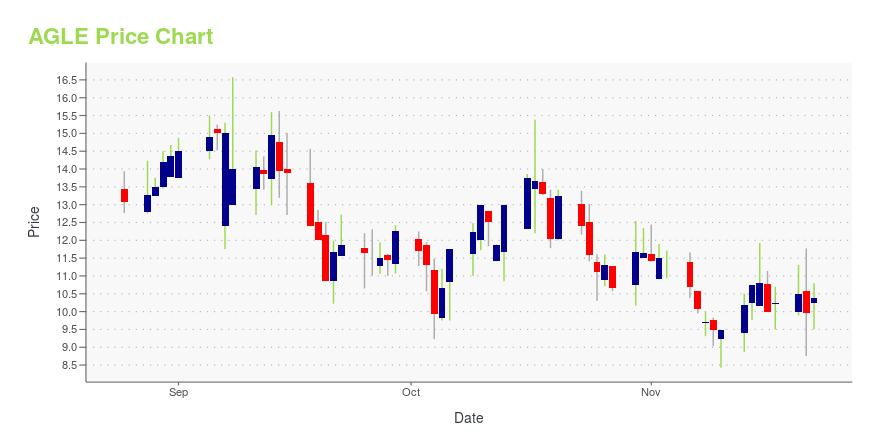
| Current price | $12.01 | 52-week high | $32.75 |
| Prev. close | $11.04 | 52-week low | $2.66 |
| Day low | $10.69 | Volume | 43,300 |
| Day high | $12.34 | Avg. volume | 95,409 |
| 50-day MA | $11.42 | Dividend yield | N/A |
| 200-day MA | $9.59 | Market Cap | 48.63M |
AGLE Stock Price Chart Interactive Chart >
Aeglea BioTherapeutics, Inc. (AGLE) Company Bio
Aeglea Biotherapeutics, Inc., a biopharmaceutical company, engages in developing engineered human enzymes for the treatment of inborn errors of metabolism and cancer. The company was founded in 2013 and is based in Austin, Texas.
Latest AGLE News From Around the Web
Below are the latest news stories about AEGLEA BIOTHERAPEUTICS INC that investors may wish to consider to help them evaluate AGLE as an investment opportunity.
Aeglea BioTherapeutics Announces Grants of Inducement AwardsAeglea BioTherapeutics, Inc. ("Aeglea") (NASDAQ: AGLE), a biotechnology company advancing a pipeline of antibody therapeutics with the potential to transform the treatment of inflammatory bowel disease ("IBD"), today announced that Aeglea's independent Compensation Committee of the Board of Directors approved the grants of stock options to purchase an aggregate of 351,750 shares of common stock and a grant of 18,912 restricted stock units to four non-executive employees as equity inducement awar |
Aeglea BioTherapeutics Reports Third Quarter 2023 Financial Results and Provides Corporate UpdateAeglea BioTherapeutics, Inc. ("Aeglea" or the "Company") (NASDAQ:AGLE), a biotechnology company advancing a pipeline of antibody therapeutics with the potential to transform the treatment of inflammatory bowel disease ("IBD"), today announced its third quarter 2023 financial results and provided program and corporate updates. |
Aeglea BioTherapeutics to Participate in Upcoming November Investor ConferencesAeglea BioTherapeutics, Inc. ("Aeglea") (Nasdaq: AGLE), a biotechnology company advancing a pipeline of antibody therapeutics with the potential to transform the treatment of inflammatory bowel disease ("IBD"), today announced that management will participate in the following investor conferences: |
Aeglea BioTherapeutics to Participate in Upcoming September ConferenceAeglea BioTherapeutics, Inc. ("Aeglea") (Nasdaq: AGLE), a biotechnology company advancing a pipeline of antibody therapeutics with the potential to transform the treatment of inflammatory bowel disease ("IBD"), today announced that management will participate in the Stifel 2023 Immunology & Inflammation Virtual Summit. |
Aeglea BioTherapeutics Announces Reverse Stock SplitAeglea BioTherapeutics, Inc. ("Aeglea") (Nasdaq: AGLE), a biotechnology company advancing a pipeline of antibody therapeutics with the potential to transform the treatment of inflammatory bowel disease ("IBD"), today announced it will effect a reverse stock split of all outstanding shares of Aeglea's common stock at a ratio of 1-for-25. Aeglea expects its common stock to begin trading on a split-adjusted basis on the Nasdaq Capital Market as of the commencement of trading on September 8, 2023. |
AGLE Price Returns
| 1-mo | N/A |
| 3-mo | N/A |
| 6-mo | N/A |
| 1-year | -14.32% |
| 3-year | -92.75% |
| 5-year | -94.25% |
| YTD | N/A |
| 2023 | 0.00% |
| 2022 | -90.53% |
| 2021 | -39.64% |
| 2020 | 3.01% |
| 2019 | 2.00% |
Loading social stream, please wait...