
AGM Group Holdings Inc. (AGMH): Price and Financial Metrics
AGMH Price/Volume Stats
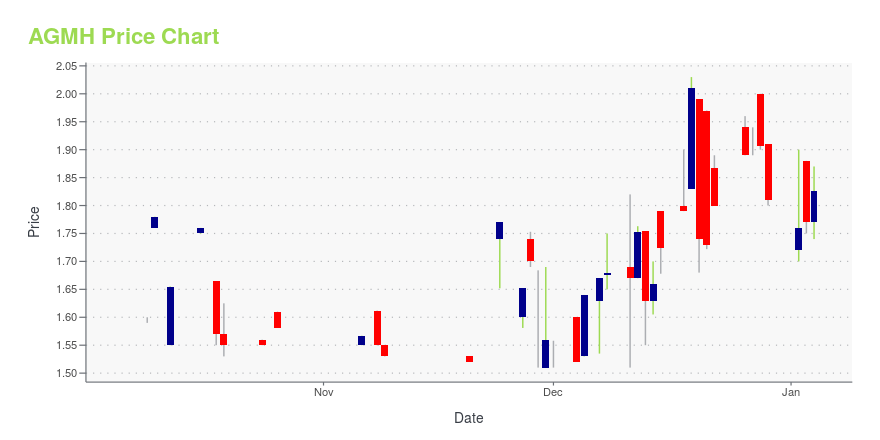
| Current price | $0.76 | 52-week high | $2.20 |
| Prev. close | $0.60 | 52-week low | $0.46 |
| Day low | $0.60 | Volume | 155,441 |
| Day high | $0.80 | Avg. volume | 96,842 |
| 50-day MA | $0.77 | Dividend yield | N/A |
| 200-day MA | $1.41 | Market Cap | 19.95M |
AGMH Stock Price Chart Interactive Chart >
AGM Group Holdings Inc. (AGMH) Company Bio
AGM Group Holdings Inc. is a financial technology company and financial solutions provider. The Company mainly provides brokers and institutional clients with trading platform solutions and technologies. The Company operates mainly through three businesses, including online trading and computer support service business, which provides online trading platform application and computer program technical support and solution services; forex trading brokerage business, as well as program trading application technology and management service business. The Company operates its businesses in both the United Stated and global markets.
Latest AGMH News From Around the Web
Below are the latest news stories about AGM GROUP HOLDINGS INC that investors may wish to consider to help them evaluate AGMH as an investment opportunity.
11 Best Stocks to Buy for the Next 10 YearsIn this piece, we will take a look at the 11 best stocks to buy for the next ten years. If you want to skip our take on what’s happening in the stock market right now and some future predictions, then you can take a look at the 5 Best Stocks to Buy for the […] |
AGM Group Holdings Full Year 2022 Earnings: EPS: US$0.47 (vs US$0.17 in FY 2021)AGM Group Holdings ( NASDAQ:AGMH ) Full Year 2022 Results Key Financial Results Revenue: US$242.4m (up by US$205.7m... |
10 Most Undervalued Hong Kong Stocks To Buy According To Hedge FundsIn this article, we will take a look at the 10 most undervalued Hong Kong stocks to buy according to hedge funds. To see more such companies, go directly to 5 Most Undervalued Hong Kong Stocks To Buy According To Hedge Funds. While the rest of the world is still debating whether or not financial […] |
AGM Group Receives Notification from Nasdaq Relating Delayed Filing of Form 20-FAGM Group Holdings Inc. ("AGM Group " or the "Company") (NASDAQ: AGMH), an integrated technology company focusing on providing fintech software services and producing high-performance hardware and computing equipment, today announced that it received a notification letter dated May 17, 2023 (the "Notification Letter") from Nasdaq notifying that the Company is not in compliance with the requirements for continued listing set forth in Nasdaq Listing Rule 5250(c)(1) since the Company did not timely |
AGM Group Holdings Inc. (NASDAQ:AGMH) Shares Fly 28% But Investors Aren't Buying For GrowthAGM Group Holdings Inc. ( NASDAQ:AGMH ) shareholders have had their patience rewarded with a 28% share price jump in... |
AGMH Price Returns
| 1-mo | 46.58% |
| 3-mo | -28.30% |
| 6-mo | -52.50% |
| 1-year | -56.20% |
| 3-year | -91.64% |
| 5-year | -95.50% |
| YTD | -58.01% |
| 2023 | 9.70% |
| 2022 | -31.25% |
| 2021 | -84.29% |
| 2020 | -9.77% |
| 2019 | -36.69% |
Continue Researching AGMH
Want to do more research on Agm Group Holdings Inc's stock and its price? Try the links below:Agm Group Holdings Inc (AGMH) Stock Price | Nasdaq
Agm Group Holdings Inc (AGMH) Stock Quote, History and News - Yahoo Finance
Agm Group Holdings Inc (AGMH) Stock Price and Basic Information | MarketWatch
Loading social stream, please wait...