
Agile Therapeutics, Inc. (AGRX): Price and Financial Metrics
AGRX Price/Volume Stats
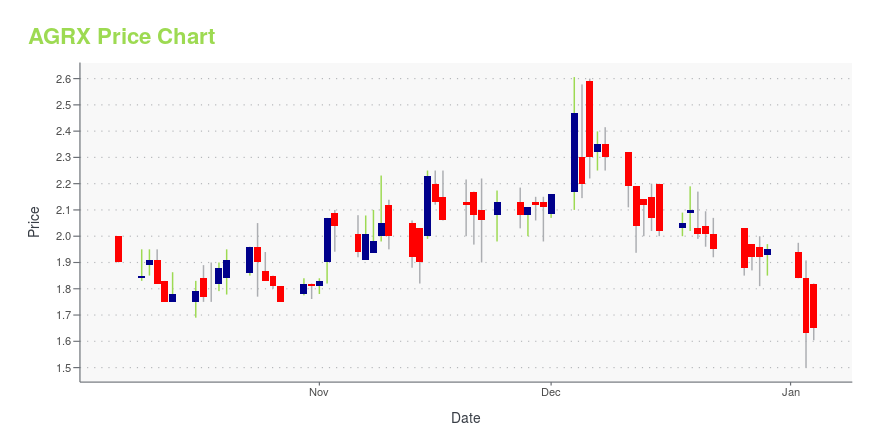
| Current price | $1.45 | 52-week high | $3.00 |
| Prev. close | $1.44 | 52-week low | $0.20 |
| Day low | $1.43 | Volume | 75,830 |
| Day high | $1.45 | Avg. volume | 394,845 |
| 50-day MA | $0.83 | Dividend yield | N/A |
| 200-day MA | $1.19 | Market Cap | 9.94M |
AGRX Stock Price Chart Interactive Chart >
Agile Therapeutics, Inc. (AGRX) Company Bio
Agile Therapeutics, Inc. focuses on the development and commercialization of prescription contraceptive products for women. The company was founded in 1997 and is based in Princeton, New Jersey.
Latest AGRX News From Around the Web
Below are the latest news stories about AGILE THERAPEUTICS INC that investors may wish to consider to help them evaluate AGRX as an investment opportunity.
Agile Therapeutics Provides Update on Actions Being Taken to Strengthen the Affordable Care Act’s No-Cost Contraceptive Coverage RequirementThe Company Commends House Committee on Oversight and Accountability Ranking Member Jamie Raskin for New Report on Contraception Coverage Gaps New Report Follows Several Months of Activity by the Biden Administration and Lawmakers to Strengthen Access to Contraception as Defined in President Biden’s June 2023 Executive Order Implementation of the Committee’s Recommendation Could Potentially Eliminate Financial Barriers for Contraceptive Products like Twirla® for 49 Million Women PRINCETON, N.J., |
Agile Therapeutics Posts Growth In Third Quarter Results, Reiterates Confidence In Target of $25M Net Revenue, Positive Cash Flow In 2024PRINCETON, NJ / ACCESSWIRE / November 22, 2023 / Agile Therapeutics, Inc. (NASDAQ:AGRX), the commercial-stage women's healthcare company, posted a 122% increase in third-quarter revenue year-over-year, driven by strong demand for TwirlaⓇ (levonorgestrel ... |
Agile Therapeutics, Inc. (NASDAQ:AGRX) Q3 2023 Earnings Call TranscriptAgile Therapeutics, Inc. (NASDAQ:AGRX) Q3 2023 Earnings Call Transcript November 9, 2023 Agile Therapeutics, Inc. beats earnings expectations. Reported EPS is $-0.27, expectations were $-1.58. Operator: Good morning, and welcome to the Agile Therapeutics Third Quarter 2023 Financial Results Conference Call. Please note, today’s event is being recorded. I would now like to turn the […] |
Agile Therapeutics Reports Third Quarter 2023 Financial Results and Provides Corporate UpdateTwirla Delivers Third Quarter 2023 Net Revenue of $6.7 Million, a 21% Increase from Second Quarter 2023 Company Announces It Expects to Generate Positive Cash Flow from Operations in First Quarter 2024 Gross Margin Grows to 63% in Third Quarter 2023 from 58% in Second Quarter 2023 Company Reaffirms Expected Full Year 2023 Net Revenue of At Least $25 Million Management to Host Conference Call Today, Thursday, November 9, 2023 at 8:30 a.m. ET PRINCETON, N.J., Nov. 09, 2023 (GLOBE NEWSWIRE) -- Agil |
Agile Therapeutics to Report Third Quarter 2023 Financial Results and Provide Business Update on Thursday, November 9, 2023Live Conference Call and Webcast at 8:30 a.m. ET PRINCETON, N.J., Oct. 26, 2023 (GLOBE NEWSWIRE) -- Agile Therapeutics, Inc. (Nasdaq: AGRX), a women's healthcare company, today announced it will report third quarter 2023 financial results before the market open on Thursday, November 9, 2023. Following the release, the Company will host a live conference call and webcast at 8:30 a.m. ET to discuss the Company’s financial results and provide a business update. EventAgile Therapeutics Third Quarter |
AGRX Price Returns
| 1-mo | 0.69% |
| 3-mo | 262.50% |
| 6-mo | -8.23% |
| 1-year | -44.76% |
| 3-year | -99.93% |
| 5-year | -99.94% |
| YTD | -25.64% |
| 2023 | -82.82% |
| 2022 | -98.84% |
| 2021 | -82.99% |
| 2020 | 14.80% |
| 2019 | 331.03% |
Loading social stream, please wait...