American International Group, Inc. New (AIG): Price and Financial Metrics
AIG Price/Volume Stats
Current price | $65.25 | 52-week high | $66.68 |
Prev. close | $65.37 | 52-week low | $45.66 |
Day low | $64.81 | Volume | 2,066,864 |
Day high | $65.85 | Avg. volume | 3,963,771 |
50-day MA | $62.67 | Dividend yield | 2.18% |
200-day MA | $57.72 | Market Cap | 45.81B |
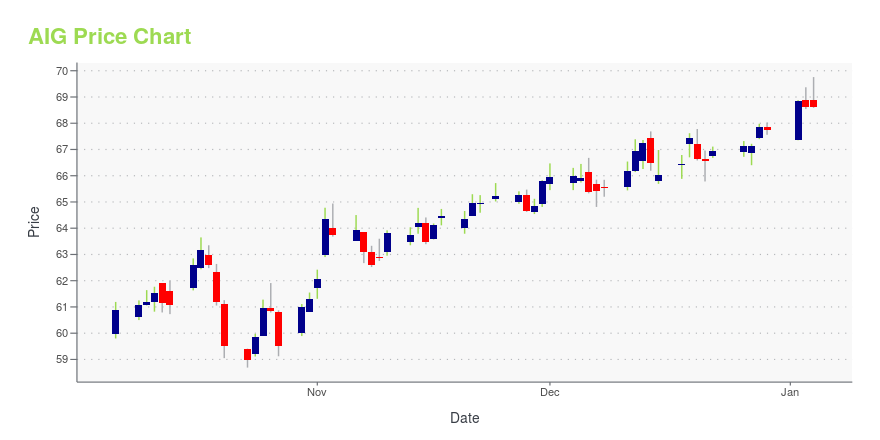
AIG Stock Price Chart Interactive Chart >
AIG POWR Grades
- Momentum is the dimension where AIG ranks best; there it ranks ahead of 96.11% of US stocks.
- AIG's strongest trending metric is Growth; it's been moving up over the last 177 days.
- AIG's current lowest rank is in the Quality metric (where it is better than 33.64% of US stocks).
AIG Stock Summary
- AIG has a higher market value than 94.87% of US stocks; more precisely, its current market capitalization is $46,313,601,428.
- Of note is the ratio of AMERICAN INTERNATIONAL GROUP INC's sales and general administrative expense to its total operating expenses; 97.39% of US stocks have a lower such ratio.
- Equity multiplier, or assets relative to shareholders' equity, comes in at 12.8 for AMERICAN INTERNATIONAL GROUP INC; that's greater than it is for 94.38% of US stocks.
- Stocks with similar financial metrics, market capitalization, and price volatility to AMERICAN INTERNATIONAL GROUP INC are AFL, COF, DFS, IT, and HSY.
- Visit AIG's SEC page to see the company's official filings. To visit the company's web site, go to www.aig.com.
AIG Valuation Summary
- AIG's EV/EBIT ratio is 11.3; this is 0.89% higher than that of the median Financial Services stock.
- AIG's price/sales ratio has moved down 1.1 over the prior 243 months.
Below are key valuation metrics over time for AIG.
Stock | Date | P/S | P/B | P/E | EV/EBIT |
---|---|---|---|---|---|
AIG | 2023-11-28 | 0.9 | 1.1 | 12.0 | 11.3 |
AIG | 2023-11-27 | 0.9 | 1.1 | 12.1 | 11.4 |
AIG | 2023-11-24 | 0.9 | 1.1 | 12.1 | 11.4 |
AIG | 2023-11-22 | 0.9 | 1.1 | 12.0 | 11.4 |
AIG | 2023-11-21 | 0.9 | 1.1 | 12.0 | 11.4 |
AIG | 2023-11-20 | 0.9 | 1.1 | 11.9 | 11.3 |
AIG Growth Metrics
- Its year over year price growth rate is now at 21.35%.
- Its 2 year net cashflow from operations growth rate is now at 16652.94%.
- Its 2 year price growth rate is now at 147.89%.

The table below shows AIG's growth in key financial areas (numbers in millions of US dollars).
Date | Revenue | Operating Cash Flow | Net Income to Common Stock |
---|---|---|---|
2022-12-31 | 56,437 | 4,207 | 10,247 |
2022-09-30 | 58,938 | 4,533 | 13,722 |
2022-06-30 | 57,171 | 4,100 | 12,680 |
2022-03-31 | 53,411 | 5,696 | 9,743 |
2021-12-31 | 52,057 | 6,279 | 9,359 |
2021-09-30 | 47,646 | 4,570 | 5,560 |
AIG's Quality Factors
The “Quality” component of the POWR Ratings focuses on 31 different factors of a companies fundamentals and operational strength. Here are some key insights as we drill into the specifics of these quality attributes.- AIG has a Quality Grade of D, ranking ahead of 24.79% of graded US stocks.
- AIG's asset turnover comes in at 0.077 -- ranking 115th of 133 Insurance stocks.
- ESNT, ITIC, and HCI are the stocks whose asset turnover ratios are most correlated with AIG.
The table below shows AIG's key quality metrics over time.
Period | Asset Turnover | Gross Margin | ROIC |
---|---|---|---|
2021-06-30 | 0.077 | 0.408 | 0.010 |
2021-03-31 | 0.076 | 0.379 | -0.006 |
2020-12-31 | 0.078 | 0.350 | -0.010 |
2020-09-30 | 0.084 | 0.380 | -0.007 |
2020-06-30 | 0.091 | 0.391 | -0.006 |
2020-03-31 | 0.099 | 0.441 | 0.014 |
AIG Price Target
For more insight on analysts targets of AIG, see our AIG price target page. And for a list of of all stocks sorted by upside potential based on analyst target price, see our Top Price Target page.
Average Price Target | $58.00 | Average Broker Recommendation | 1.6 (Moderate Buy) |
American International Group, Inc. New (AIG) Company Bio
American International Group Inc is an insurance company. AIG traces its beginnings to the Americans Asiatic Underwritings company, established by Cornelius Vander Starr while in Shanghai in 1919. The company, through its subsidiaries, provides property casualty insurance, life insurance, retirement products, mortgage insurance and other financial services in the United States and in 80 countries abroad. Peter Zaffino was appointed President of AIG in early 2020 and became the Chief Executive Officer of the company a year later. The company is headquartered in New York City and it employs a workforce of over 46,000 people worldwide. In FY 2020, AIG had total sales of $51 billion U.S. dollars.
Latest AIG News From Around the Web
Below are the latest news stories about AMERICAN INTERNATIONAL GROUP INC that investors may wish to consider to help them evaluate AIG as an investment opportunity.
Jimmy Dunne Elected to AIG’s Board of DirectorsNEW YORK, December 04, 2023--American International Group (NYSE: AIG) today announced that its Board of Directors has elected James (Jimmy) Dunne III as an independent Director, effective December 1, 2023. |
AIG Optimizes Portfolio With $718M CRBG Secondary OfferingAIG is selling from a total of around 630 million outstanding common shares of Corebridge and will receive all the net proceeds from the sale. |
Why Is American International Group (AIG) Up 2.3% Since Last Earnings Report?American International Group (AIG) reported earnings 30 days ago. What's next for the stock? We take a look at earnings estimates for some clues. |
AIG Announces Pricing of Secondary Offering of Corebridge Financial, Inc. Common StockNEW YORK, December 01, 2023--American International Group, Inc. (NYSE: AIG) today announced that it has priced the secondary offering of Corebridge Financial, Inc. (NYSE: CRBG) common stock at $20.50 per share. The offering is expected to close on December 5, 2023, subject to customary closing conditions. |
AIG Announces Launch of Secondary Offering of Corebridge Financial, Inc. Common StockNEW YORK, December 01, 2023--American International Group, Inc. (NYSE: AIG) today announced the launch of a secondary offering of Corebridge Financial, Inc. (NYSE: CRBG) common stock. AIG, as the selling stockholder, is offering 35 million existing shares of common stock (out of approximately 630 million total shares of common stock outstanding) of Corebridge and has granted a 30-day option to the underwriter to purchase up to an additional 5.25 million shares. AIG will remain a majority shareho |
AIG Price Returns
1-mo | 3.41% |
3-mo | 10.02% |
6-mo | 16.15% |
1-year | 7.76% |
3-year | 76.65% |
5-year | 98.45% |
YTD | 5.17% |
2022 | 13.76% |
2021 | 53.92% |
2020 | -23.08% |
2019 | 33.58% |
2018 | -32.09% |
AIG Dividends
Ex-Dividend Date | Type | Payout Amount | Change | ||||||
---|---|---|---|---|---|---|---|---|---|
Loading, please wait... |
Continue Researching AIG
Want to see what other sources are saying about American International Group Inc's financials and stock price? Try the links below:American International Group Inc (AIG) Stock Price | Nasdaq
American International Group Inc (AIG) Stock Quote, History and News - Yahoo Finance
American International Group Inc (AIG) Stock Price and Basic Information | MarketWatch
Loading social stream, please wait...