Albany International Corporation (AIN): Price and Financial Metrics
GET POWR RATINGS... FREE!
AIN POWR Grades
- AIN scores best on the Quality dimension, with a Quality rank ahead of 94.88% of US stocks.
- The strongest trend for AIN is in Growth, which has been heading up over the past 179 days.
- AIN's current lowest rank is in the Growth metric (where it is better than 50.97% of US stocks).
AIN Stock Summary
- AIN's one year PEG ratio, measuring expected growth in earnings next year relative to current common stock price is 137.95 -- higher than 82.87% of US-listed equities with positive expected earnings growth.
- Albany International Corp's stock had its IPO on September 30, 1987, making it an older stock than 91.42% of US equities in our set.
- In terms of volatility of its share price, AIN is more volatile than only 9.97% of stocks we're observing.
- If you're looking for stocks that are quantitatively similar to Albany International Corp, a group of peers worth examining would be BELFA, ASYS, MOG.A, VOXX, and OLK.
- AIN's SEC filings can be seen here. And to visit Albany International Corp's official web site, go to www.albint.com.
AIN Valuation Summary
- AIN's price/sales ratio is 2.9; this is 6.45% lower than that of the median Consumer Cyclical stock.
- Over the past 243 months, AIN's EV/EBIT ratio has gone up 10.4.
- Over the past 243 months, AIN's price/earnings ratio has gone up 15.2.
Below are key valuation metrics over time for AIN.
Stock | Date | P/S | P/B | P/E | EV/EBIT |
---|---|---|---|---|---|
AIN | 2021-08-27 | 2.9 | 3.0 | 22.1 | 15.7 |
AIN | 2021-08-26 | 2.8 | 2.9 | 21.5 | 15.3 |
AIN | 2021-08-25 | 2.8 | 2.9 | 21.9 | 15.5 |
AIN | 2021-08-24 | 2.8 | 2.9 | 21.6 | 15.3 |
AIN | 2021-08-23 | 2.8 | 2.9 | 21.5 | 15.3 |
AIN | 2021-08-20 | 2.8 | 2.9 | 21.4 | 15.2 |
AIN Growth Metrics
- Its 2 year price growth rate is now at -15.89%.
- Its year over year net income to common stockholders growth rate is now at 4.22%.
- Its 2 year cash and equivalents growth rate is now at 47.06%.

The table below shows AIN's growth in key financial areas (numbers in millions of US dollars).
Date | Revenue | Operating Cash Flow | Net Income to Common Stock |
---|---|---|---|
2021-12-31 | 929.24 | 217.475 | 118.478 |
2021-09-30 | 916.18 | 205.058 | 117.378 |
2021-06-30 | 895.737 | 191.858 | 116.105 |
2021-03-31 | 887.208 | 180.577 | 117.062 |
2020-12-31 | 900.61 | 140.253 | 98.589 |
2020-09-30 | 931.431 | 157.452 | 100.197 |
AIN's Quality Factors
The “Quality” component of the POWR Ratings focuses on 31 different factors of a companies fundamentals and operational strength. Here are some key insights as we drill into the specifics of these quality attributes.- AIN has a Quality Grade of B, ranking ahead of 94.09% of graded US stocks.
- AIN's asset turnover comes in at 0.598 -- ranking 7th of 7 Textiles stocks.
- CRWS, DXYN, and TILE are the stocks whose asset turnover ratios are most correlated with AIN.
The table below shows AIN's key quality metrics over time.
Period | Asset Turnover | Gross Margin | ROIC |
---|---|---|---|
2021-09-30 | 0.598 | 0.408 | 0.142 |
2021-06-30 | 0.589 | 0.412 | 0.135 |
2021-03-31 | 0.590 | 0.417 | 0.135 |
2020-12-31 | 0.602 | 0.412 | 0.121 |
2020-09-30 | 0.630 | 0.404 | 0.127 |
2020-06-30 | 0.680 | 0.397 | 0.140 |
AIN Price Target
For more insight on analysts targets of AIN, see our AIN price target page. And for a list of of all stocks sorted by upside potential based on analyst target price, see our Top Price Target page.
Average Price Target | $91.83 | Average Broker Recommendation | 1.79 (Moderate Buy) |
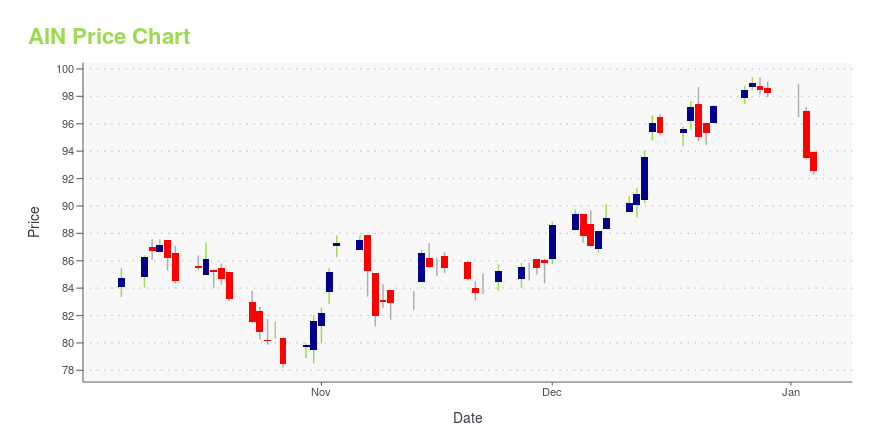
AIN Stock Price Chart Interactive Chart >
AIN Price/Volume Stats
Current price | $78.27 | 52-week high | $91.53 |
Prev. close | $78.46 | 52-week low | $74.17 |
Day low | $77.06 | Volume | 96,500 |
Day high | $78.51 | Avg. volume | 160,948 |
50-day MA | $81.28 | Dividend yield | 1.07% |
200-day MA | $83.55 | Market Cap | 2.47B |
Albany International Corporation (AIN) Company Bio
Albany International Corporation engages in the textile and materials processing businesses worldwide. The company operates through Machine Clothing (MC) and Albany Engineered Composites (AEC) segments. The company was founded in 1895 and is based in Rochester, New Hampshire.
Latest AIN News From Around the Web
Below are the latest news stories about Albany International Corp that investors may wish to consider to help them evaluate AIN as an investment opportunity.
Albany International Declares DividendROCHESTER, N.H., February 25, 2022--The Board of Directors of Albany International Corp. (NYSE: AIN) today declared a quarterly dividend of $0.21 per share on the Company’s Class A and Class B Common Stock, payable April 7, 2022, to shareholders of record on March 21, 2022. |
New Strong Sell Stocks for February 24thAMG, AIN, and HEP have been added to the Zacks Rank #5 (Strong Sell) List on February 24, 2022 |
Albany International Named to Forbes America’s Best Employers 2022 ListROCHESTER, N.H., February 21, 2022--Albany International Corp. (NYSE:AIN), a leading developer and manufacturer of engineered components, has been recognized on the Forbes list of America’s Best Employers 2022. |
Albany International Corp. (AIN) CEO Bill Higgins on Q4 2021 Results - Earnings Call TranscriptNo summary available. |
Albany International Reports Fourth-Quarter 2021 ResultsROCHESTER, N.H.--(BUSINESS WIRE)--Albany International Corp. (NYSE:AIN) today reported operating results for its fourth quarter of 2021, which ended December 31, 2021. "We are pleased to report another strong quarter, capping a great year in 2021," said Bill Higgins, President and Chief Executive Officer. "Our employees performed remarkably well throughout the year serving customers, winning new business, developing new products, and navigating supply chain and COVID challenges. For the year th |
AIN Price Returns
1-mo | -7.03% |
3-mo | -8.56% |
6-mo | -11.07% |
1-year | -11.44% |
3-year | -3.08% |
5-year | 54.98% |
YTD | -11.07% |
2021 | 21.62% |
2020 | -1.80% |
2019 | 22.79% |
2018 | 2.66% |
2017 | 34.48% |
AIN Dividends
Ex-Dividend Date | Type | Payout Amount | Change | ||||||
---|---|---|---|---|---|---|---|---|---|
Loading, please wait... |
Continue Researching AIN
Want to see what other sources are saying about Albany International Corp's financials and stock price? Try the links below:Albany International Corp (AIN) Stock Price | Nasdaq
Albany International Corp (AIN) Stock Quote, History and News - Yahoo Finance
Albany International Corp (AIN) Stock Price and Basic Information | MarketWatch
Loading social stream, please wait...