
Ashford Inc. (Holding Company) (AINC): Price and Financial Metrics
AINC Price/Volume Stats
| Current price | $4.97 | 52-week high | $9.50 |
| Prev. close | $4.96 | 52-week low | $1.91 |
| Day low | $4.96 | Volume | 209,004 |
| Day high | $5.00 | Avg. volume | 168,184 |
| 50-day MA | $4.89 | Dividend yield | N/A |
| 200-day MA | $4.33 | Market Cap | 17.11M |
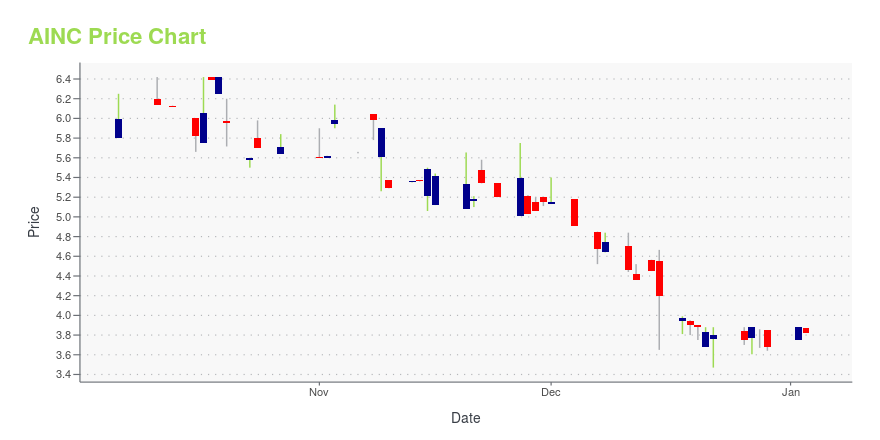
AINC Stock Price Chart Interactive Chart >
Latest AINC News From Around the Web
Below are the latest news stories about ASHFORD INC that investors may wish to consider to help them evaluate AINC as an investment opportunity.
ASHFORD SETS FOURTH QUARTER EARNINGS RELEASE AND CONFERENCE CALL DATESAshford Inc. (NYSE American: AINC) ("Ashford" or the "Company") today announced details for the release of its results for the fourth quarter ended December 31, 2023. |
ASHFORD RECEIVES LETTER OF NON-COMPLIANCE FROM NYSE AMERICANAshford Inc. (NYSE American: AINC) ("Ashford" or the "Company") today announced that it received a letter from the NYSE American LLC (the "NYSE American") dated December 20, 2023, notifying that the Company is no longer in compliance with NYSE American continued listing standards. Specifically, the letter states that the Company is not in compliance with the continued listing standards set forth in Sections 1003(a)(i) and (ii) of the NYSE American Company Guide (the "Company Guide"). Section 100 |
ASHFORD ANNOUNCES DATE CHANGE FOR THIRD QUARTER EARNINGS RELEASE AND CONFERENCE CALLAshford Inc. (NYSE American: AINC) ("Ashford" or the "Company") today announced that it is moving its third quarter 2023 earnings release and earnings conference call to one day earlier. |
ASHFORD ANNOUNCES DATE AND TIME CHANGE FOR THIRD QUARTER EARNINGS RELEASE AND CONFERENCE CALLAshford Inc. (NYSE American: AINC) ("Ashford" or the "Company") today announced that the Company has changed the scheduled date and start time of its third quarter 2023 earnings conference call. The call was previously scheduled for Thursday, November 2, 2023, at 1:00 p.m. ET. |
ASHFORD SETS THIRD QUARTER EARNINGS RELEASE AND CONFERENCE CALL DATESAshford Inc. (NYSE American: AINC) ("Ashford" or the "Company") today announced details for the release of its results for the third quarter ended September 30, 2023. |
AINC Price Returns
| 1-mo | 0.81% |
| 3-mo | 2.47% |
| 6-mo | 65.12% |
| 1-year | N/A |
| 3-year | -69.51% |
| 5-year | -85.26% |
| YTD | 35.04% |
| 2023 | -73.48% |
| 2022 | -16.64% |
| 2021 | 94.06% |
| 2020 | -63.64% |
| 2019 | -54.53% |
Continue Researching AINC
Here are a few links from around the web to help you further your research on Ashford Inc's stock as an investment opportunity:Ashford Inc (AINC) Stock Price | Nasdaq
Ashford Inc (AINC) Stock Quote, History and News - Yahoo Finance
Ashford Inc (AINC) Stock Price and Basic Information | MarketWatch
Loading social stream, please wait...