Akebia Therapeutics, Inc. (AKBA): Price and Financial Metrics
GET POWR RATINGS... FREE!
AKBA Stock Summary
- AKEBIA THERAPEUTICS INC's capital turnover -- a measure of revenue relative to shareholder's equity -- is better than 98.68% of US listed stocks.
- Equity multiplier, or assets relative to shareholders' equity, comes in at 11.29 for AKEBIA THERAPEUTICS INC; that's greater than it is for 93.4% of US stocks.
- AKEBIA THERAPEUTICS INC's shareholder yield -- a measure of how much capital is returned to stockholders via dividends and buybacks -- is 15.31%, greater than the shareholder yield of 89.72% of stocks in our set.
- Stocks with similar financial metrics, market capitalization, and price volatility to AKEBIA THERAPEUTICS INC are ARAY, INFN, CYRN, PBYI, and CASA.
- AKBA's SEC filings can be seen here. And to visit AKEBIA THERAPEUTICS INC's official web site, go to www.akebia.com.
AKBA Valuation Summary
- AKBA's price/earnings ratio is -0.9; this is 103.96% lower than that of the median Healthcare stock.
- Over the past 108 months, AKBA's price/sales ratio has gone NA NA.
Below are key valuation metrics over time for AKBA.
Stock | Date | P/S | P/B | P/E | EV/EBIT |
---|---|---|---|---|---|
AKBA | 2023-01-20 | 0.5 | 9.8 | -0.9 | -0.6 |
AKBA | 2023-01-19 | 0.4 | 9.4 | -0.8 | -0.6 |
AKBA | 2023-01-18 | 0.4 | 9.6 | -0.8 | -0.6 |
AKBA | 2023-01-17 | 0.5 | 9.7 | -0.9 | -0.6 |
AKBA | 2023-01-13 | 0.4 | 9.2 | -0.8 | -0.6 |
AKBA | 2023-01-12 | 0.4 | 9.2 | -0.8 | -0.6 |
AKBA Growth Metrics
- Its 5 year price growth rate is now at -3.94%.
- Its 4 year net cashflow from operations growth rate is now at -775.74%.
- The 5 year net cashflow from operations growth rate now stands at -775.74%.

The table below shows AKBA's growth in key financial areas (numbers in millions of US dollars).
Date | Revenue | Operating Cash Flow | Net Income to Common Stock |
---|---|---|---|
2022-09-30 | 297.027 | -81.283 | -155.688 |
2022-06-30 | 296.819 | -171.358 | -163.367 |
2022-03-31 | 222.973 | -203.839 | -275.681 |
2021-12-31 | 213.578 | -252.965 | -282.84 |
2021-09-30 | 210.672 | -220.939 | -299.162 |
2021-06-30 | 221.904 | -191.906 | -299.577 |
AKBA's Quality Factors
The “Quality” component of the POWR Ratings focuses on 31 different factors of a companies fundamentals and operational strength. Here are some key insights as we drill into the specifics of these quality attributes.- AKBA has a Quality Grade of C, ranking ahead of 61.34% of graded US stocks.
- AKBA's asset turnover comes in at 0.347 -- ranking 132nd of 682 Pharmaceutical Products stocks.
- BPTH, ASLN, and ARDX are the stocks whose asset turnover ratios are most correlated with AKBA.
The table below shows AKBA's key quality metrics over time.
Period | Asset Turnover | Gross Margin | ROIC |
---|---|---|---|
2021-06-30 | 0.347 | 0.186 | -1.786 |
2021-03-31 | 0.385 | -0.169 | -2.192 |
2020-12-31 | 0.414 | -0.002 | -1.908 |
2020-09-30 | 0.414 | 0.121 | -1.912 |
2020-06-30 | 0.439 | 0.181 | -2.161 |
2020-03-31 | 0.442 | 0.596 | -1.469 |
AKBA Price Target
For more insight on analysts targets of AKBA, see our AKBA price target page. And for a list of of all stocks sorted by upside potential based on analyst target price, see our Top Price Target page.
Average Price Target | $6.54 | Average Broker Recommendation | 1.62 (Moderate Buy) |
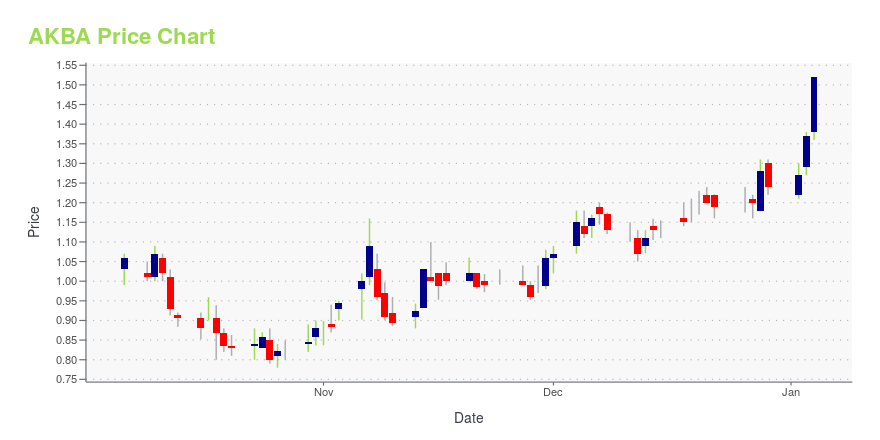
AKBA Stock Price Chart Interactive Chart >
AKBA Price/Volume Stats
Current price | $0.67 | 52-week high | $2.93 |
Prev. close | $0.71 | 52-week low | $0.24 |
Day low | $0.56 | Volume | 2,648,500 |
Day high | $0.72 | Avg. volume | 1,623,139 |
50-day MA | $0.47 | Dividend yield | N/A |
200-day MA | $0.40 | Market Cap | 123.25M |
Akebia Therapeutics, Inc. (AKBA) Company Bio
Akebia Therapeutics focuses on the development and commercialization of proprietary therapeutics based on hypoxia inducible factor (HIF) biology for patients with kidney disease. The company was founded in 2007 and is based in Cambridge, Massachusetts.
Latest AKBA News From Around the Web
Below are the latest news stories about AKEBIA THERAPEUTICS INC that investors may wish to consider to help them evaluate AKBA as an investment opportunity.
Akebia Therapeutics Reports Inducement Grants Under Nasdaq Listing Rule 5635(c)(4)Akebia Therapeutics, Inc. (Nasdaq: AKBA), a biopharmaceutical company with the purpose to better the lives of people impacted by kidney disease, granted one newly-hired employee options to purchase an aggregate of 2,000 shares of Akebia's common stock on December 30, 2022, as an inducement material to such employee entering into employment with Akebia. The options were granted in accordance with Nasdaq Listing Rule 5635(c)(4). |
Akebia out-licenses ferric citrate product; terminates BioVectra supply deal
|
Akebia Therapeutics Received Interim Response to Appeal for Vadadustat for the Treatment of Anemia due to Chronic Kidney Disease from the FDAAkebia Therapeutics®, Inc. (Nasdaq: AKBA), a biopharmaceutical company with the purpose to better the lives of people impacted by kidney disease, today announced that the company received an interim response from the U.S. Food and Drug Administration (FDA) to its Formal Dispute Resolution Request regarding the Complete Response Letter received in March 2022 for vadadustat, which had been submitted to the FDA as a treatment for anemia due to chronic kidney disease in adult patients. |
Akebia Therapeutics to Participate in the Piper Sandler 34th Annual Healthcare ConferenceAkebia Therapeutics, Inc. (Nasdaq: AKBA), a biopharmaceutical company with the purpose to better the lives of people impacted by kidney disease, today announced that the company will participate in the Piper Sandler 34th Annual Healthcare Conference, which takes place November 29-December 1, 2022 in New York City, New York. |
Akebia Therapeutics Third Quarter 2022 Earnings: Revenues Beat Expectations, EPS LagsAkebia Therapeutics ( NASDAQ:AKBA ) Third Quarter 2022 Results Key Financial Results Revenue: US$49.0m (flat on 3Q... |
AKBA Price Returns
1-mo | 16.12% |
3-mo | 147.23% |
6-mo | 71.57% |
1-year | -64.92% |
3-year | -90.72% |
5-year | -95.47% |
YTD | 16.12% |
2022 | -74.47% |
2021 | -19.29% |
2020 | -55.70% |
2019 | 14.29% |
2018 | -62.81% |
Continue Researching AKBA
Here are a few links from around the web to help you further your research on Akebia Therapeutics Inc's stock as an investment opportunity:Akebia Therapeutics Inc (AKBA) Stock Price | Nasdaq
Akebia Therapeutics Inc (AKBA) Stock Quote, History and News - Yahoo Finance
Akebia Therapeutics Inc (AKBA) Stock Price and Basic Information | MarketWatch
Loading social stream, please wait...