
Akumin Inc. (AKU): Price and Financial Metrics
AKU Price/Volume Stats
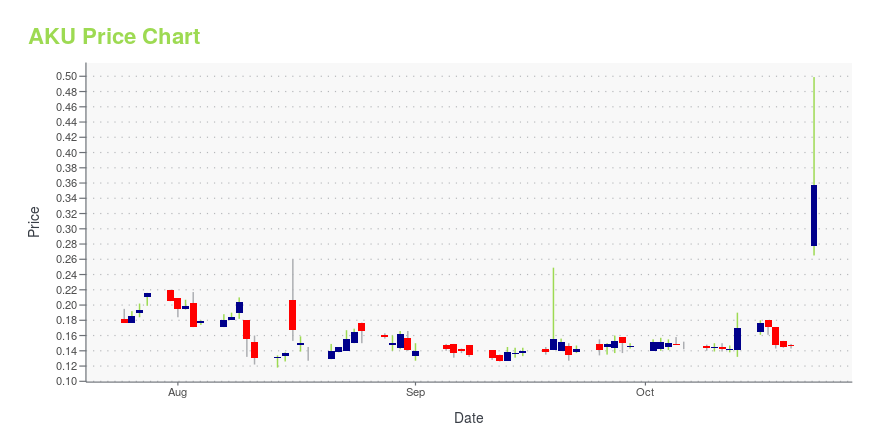
| Current price | $0.29 | 52-week high | $1.90 |
| Prev. close | $0.35 | 52-week low | $0.12 |
| Day low | $0.28 | Volume | 8,543,300 |
| Day high | $0.35 | Avg. volume | 1,379,745 |
| 50-day MA | $0.16 | Dividend yield | N/A |
| 200-day MA | $0.49 | Market Cap | 26.32M |
AKU Stock Price Chart Interactive Chart >
Akumin Inc. (AKU) Company Bio
Akumin Inc. provides outpatient diagnostic imaging services in the United States. As of December 31, 2019, the company operated 129 imaging centers located in Florida, Pennsylvania, Delaware, Georgia, Texas, Illinois, and Kansas. Its centers offer physicians with imaging capabilities to facilitate the diagnosis and treatment of diseases and disorders, and reduce unnecessary invasive procedures. The company provides a range of medical imaging services, including magnetic resonance imaging, computed tomography, positron emission tomography, nuclear medicine, mammography, ultrasound, digital radiography, fluoroscopy, radiology, and other diagnostic or interventional radiology procedures; and online medical bill payment services. Akumin Inc. is headquartered in Toronto, Canada.
Latest AKU News From Around the Web
Below are the latest news stories about AKUMIN INC that investors may wish to consider to help them evaluate AKU as an investment opportunity.
Today’s Biggest Pre-Market Stock Movers: 10 Top Gainers and Losers on TuesdayPre-market stock movers are among the biggest topics worth checking out on Tuesday and we have the latest news for investors! |
Today’s Biggest Pre-Market Stock Movers: 10 Top Gainers and Losers on FridayIt's time to close out this week of trading with an overview of the biggest pre-market stock movers to watch Friday morning! |
Today’s Biggest Pre-Market Stock Movers: 10 Top Gainers and Losers on MondayIt's time to start the week off right with a look at the biggest pre-market stock movers worth watching on Monday morning! |
Today’s Biggest Pre-Market Stock Movers: 10 Top Gainers and Losers on ThursdayIt's time for another dive into the biggest pre-market stock movers this morning as we check out the latest news on Thursday! |
Akumin Announces Change of AuditorAkumin Inc. ("Akumin" or the "Company") (NASDAQ: AKU) (TSX: AKU) announced today that it has changed its auditor from Ernst & Young LLP ("EY") to Deloitte & Touche LLP ("Deloitte"). |
AKU Price Returns
| 1-mo | N/A |
| 3-mo | N/A |
| 6-mo | N/A |
| 1-year | 50.57% |
| 3-year | -90.79% |
| 5-year | -91.08% |
| YTD | N/A |
| 2023 | 0.00% |
| 2022 | -58.93% |
| 2021 | -41.86% |
| 2020 | N/A |
| 2019 | N/A |
Loading social stream, please wait...