Allegiant Travel Company (ALGT): Price and Financial Metrics
ALGT Price/Volume Stats
Current price | $108.38 | 52-week high | $149.05 |
Prev. close | $108.23 | 52-week low | $62.94 |
Day low | $106.90 | Volume | 280,200 |
Day high | $111.16 | Avg. volume | 201,856 |
50-day MA | $98.69 | Dividend yield | N/A |
200-day MA | $87.05 | Market Cap | 2.00B |
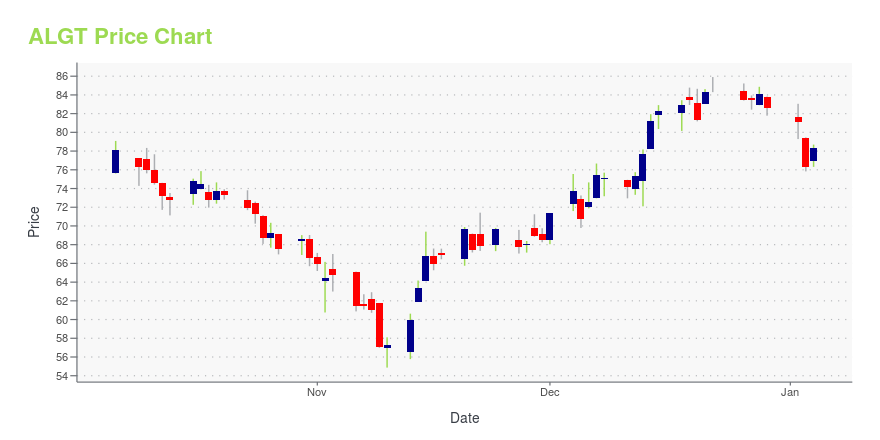
ALGT Stock Price Chart Interactive Chart >
ALGT POWR Grades
- ALGT scores best on the Growth dimension, with a Growth rank ahead of 99.25% of US stocks.
- The strongest trend for ALGT is in Growth, which has been heading up over the past 179 days.
- ALGT's current lowest rank is in the Stability metric (where it is better than 21.99% of US stocks).
ALGT Stock Summary
- With a price/earnings ratio of 27.23, ALLEGIANT TRAVEL CO P/E ratio is greater than that of about 73.98% of stocks in our set with positive earnings.
- ALGT's price/sales ratio is 0.74; that's higher than the P/S ratio of 25.81% of US stocks.
- Revenue growth over the past 12 months for ALLEGIANT TRAVEL CO comes in at 27.09%, a number that bests 76.28% of the US stocks we're tracking.
- If you're looking for stocks that are quantitatively similar to ALLEGIANT TRAVEL CO, a group of peers worth examining would be SKYW, TIGO, TTEC, SGMA, and TDS.
- Visit ALGT's SEC page to see the company's official filings. To visit the company's web site, go to www.allegiantair.com.
ALGT Valuation Summary
- ALGT's price/earnings ratio is 27.7; this is 51.37% higher than that of the median Industrials stock.
- ALGT's price/earnings ratio has moved down 20.7 over the prior 200 months.
Below are key valuation metrics over time for ALGT.
Stock | Date | P/S | P/B | P/E | EV/EBIT |
---|---|---|---|---|---|
ALGT | 2023-05-19 | 0.8 | 1.4 | 27.7 | 16.8 |
ALGT | 2023-05-18 | 0.8 | 1.5 | 28.6 | 17.1 |
ALGT | 2023-05-17 | 0.8 | 1.5 | 28.8 | 17.1 |
ALGT | 2023-05-16 | 0.7 | 1.4 | 27.3 | 16.7 |
ALGT | 2023-05-15 | 0.7 | 1.4 | 27.6 | 16.8 |
ALGT | 2023-05-12 | 0.7 | 1.4 | 27.3 | 16.7 |
ALGT Growth Metrics
- The year over year price growth rate now stands at -33.72%.
- The 4 year cash and equivalents growth rate now stands at 102.71%.
- Its year over year net cashflow from operations growth rate is now at 84.34%.

The table below shows ALGT's growth in key financial areas (numbers in millions of US dollars).
Date | Revenue | Operating Cash Flow | Net Income to Common Stock |
---|---|---|---|
2022-12-31 | 2,301.829 | 303.05 | 2.493 |
2022-09-30 | 2,187.165 | 386.42 | -39.279 |
2022-06-30 | 2,086.309 | 361.002 | 46.434 |
2022-03-31 | 1,928.895 | 546.201 | 137.103 |
2021-12-31 | 1,707.91 | 538.193 | 151.853 |
2021-09-30 | 1,457.587 | 331.492 | 112.312 |
ALGT's Quality Factors
The “Quality” component of the POWR Ratings focuses on 31 different factors of a companies fundamentals and operational strength. Here are some key insights as we drill into the specifics of these quality attributes.- ALGT has a Quality Grade of B, ranking ahead of 81.37% of graded US stocks.
- ALGT's asset turnover comes in at 0.409 -- ranking 48th of 137 Transportation stocks.
- SAVE, DAL, and AAL are the stocks whose asset turnover ratios are most correlated with ALGT.
The table below shows ALGT's key quality metrics over time.
Period | Asset Turnover | Gross Margin | ROIC |
---|---|---|---|
2021-09-30 | 0.409 | 0.230 | 0.049 |
2021-06-30 | 0.350 | 0.185 | 0.027 |
2021-03-31 | 0.263 | 0.041 | -0.042 |
2020-12-31 | 0.306 | 0.174 | -0.078 |
2020-09-30 | 0.379 | 0.241 | -0.048 |
2020-06-30 | 0.468 | 0.313 | -0.020 |
ALGT Price Target
For more insight on analysts targets of ALGT, see our ALGT price target page. And for a list of of all stocks sorted by upside potential based on analyst target price, see our Top Price Target page.
Average Price Target | $266.39 | Average Broker Recommendation | 1.5 (Moderate Buy) |
Allegiant Travel Company (ALGT) Company Bio
Allegiant Travel Company operates a low-cost, high-efficiency, all-jet passenger airline through its subsidiary, Allegiant Air, while also offering other travel-related products such as hotel rooms, rental cars, and attraction tickets. The company was founded in 1997 and is based in Las Vegas, Nevada.
Latest ALGT News From Around the Web
Below are the latest news stories about ALLEGIANT TRAVEL CO that investors may wish to consider to help them evaluate ALGT as an investment opportunity.
Old Dominion's (ODFL) LTL Segment Numbers Decline in MayOld Dominion's (ODFL) revenue per day fell 15.7% year over year in May 2023 due to a 14.4% decrease in less-than-truckload tons per day. |
Zacks Industry Outlook Highlights American Airlines, Copa Holdings and Allegiant Travel CompanyAmerican Airlines, Copa Holdings and Allegiant Travel Company are part of the Zacks Industry Outlook article. |
3 Airline Stocks to Buy Post IATA's Bullish FY23 ProjectionWe believe stocks like Copa Holdings (CPA), Volaris (VLRS) and Allegiant (ALGT) represent compelling investment opportunities at present. |
Here's Why Investors Should Buy Allegiant (ALGT) Stock NowSolid liquidity and strong air-travel demand boost Allegiant (ALGT) stock. |
3 Airline Stocks to Keep a Tab on Amid Rosy Passenger TrafficThe Zacks Industry Rank for the Transportation-Airline industry paints a bright picture mainly owing to strong passenger volumes. We believe investors should keep an eye on AAL,CPA and ALGT. |
ALGT Price Returns
1-mo | 3.50% |
3-mo | 12.83% |
6-mo | 49.82% |
1-year | -25.54% |
3-year | -18.97% |
5-year | -24.87% |
YTD | 59.41% |
2022 | -63.65% |
2021 | -1.16% |
2020 | 9.32% |
2019 | 76.98% |
2018 | -33.95% |
Continue Researching ALGT
Here are a few links from around the web to help you further your research on Allegiant Travel CO's stock as an investment opportunity:Allegiant Travel CO (ALGT) Stock Price | Nasdaq
Allegiant Travel CO (ALGT) Stock Quote, History and News - Yahoo Finance
Allegiant Travel CO (ALGT) Stock Price and Basic Information | MarketWatch
Loading social stream, please wait...