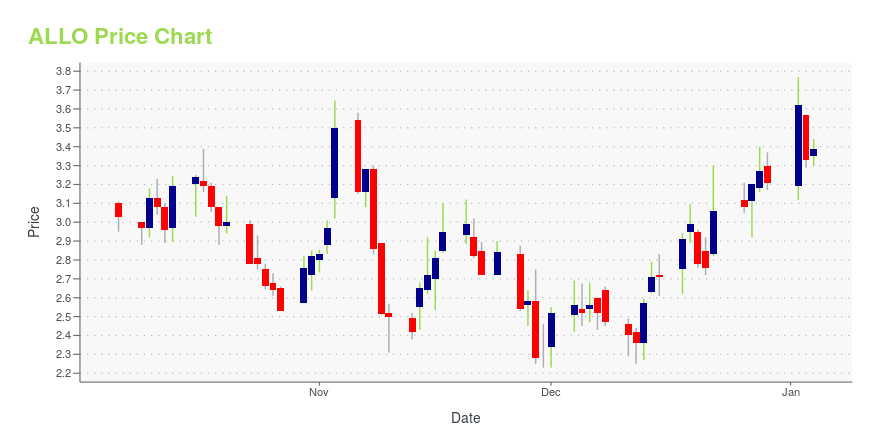
Allogene Therapeutics, Inc. (ALLO): Price and Financial Metrics
ALLO Price/Volume Stats
| Current price | $3.00 | 52-week high | $5.78 |
| Prev. close | $2.91 | 52-week low | $2.01 |
| Day low | $2.86 | Volume | 1,595,100 |
| Day high | $3.05 | Avg. volume | 2,729,191 |
| 50-day MA | $2.58 | Dividend yield | N/A |
| 200-day MA | $3.26 | Market Cap | 627.00M |
ALLO Stock Price Chart Interactive Chart >
Allogene Therapeutics, Inc. (ALLO) Company Bio
Allogene Therapeutics, Inc., a clinical stage immuno-oncology company, engages in the research, development, and commercialization of genetically engineered allogeneic T cell therapies for the treatment of cancer. The company is developing UCART19, a CAR T cell product candidate targeting CD19, which is in clinical trials in patients with R/R B-cell precursor acute lymphoblastic leukemia; ALLO-501, an allogeneic anti-CD19 CAR T cell product candidate for the treatment of patients with R/R non-Hodgkin lymphoma; ALLO-715, an allogeneic CAR T cell product candidate for the treatment of patients with R/R multiple myeloma; and ALLO-647, an anti-CD52 monoclonal antibody for use as a lymphodepleting agent. It is also developing ALLO-819, an anti-Flt3 product candidate for the treatment of acute myeloid leukemia; CD70 for the treatment of renal cell cancer; and DLL3 for the treatment of small cell lung cancer. The company was founded in 2017 and is based in South San Francisco, California.
Latest ALLO News From Around the Web
Below are the latest news stories about ALLOGENE THERAPEUTICS INC that investors may wish to consider to help them evaluate ALLO as an investment opportunity.
The Zacks Analyst Blog Highlights Allogene Therapeutics, Arcutis Biotherapeutics and C4 TherapeuticsAllogene Therapeutics, Arcutis Biotherapeutics and C4 Therapeutics are part of the Zacks top Analyst Blog. |
3 Under-$10 Drug Stocks Wall Street Analysts Recommend BuyingWe present three small biotech stocks, which most analysts on Wall Street are optimistic about. These companies have upside potential for 2024 following signals of a stabilizing market. |
3 Cancer-Focused Biotechs That Appear Promising Bets for 2024With the spotlight on oncology-focused companies in the biotech sector in 2023, we discuss three stocks that have a promising oncology portfolio/pipeline for 2024. |
Allogene Therapeutics Presents Comprehensive Safety Data of Proprietary Lymphodepletion Agent ALLO-647 at the 65th Annual Meeting of the American Society of HematologyComprehensive Review of All Patients in the Phase 1 ALPHA/ALPHA2 Trials Demonstrate that Adding Investigational ALLO-647 to Standard Lymphodepletion Can Yield Durable Responses and a Safety Profile Comparable to Approved Autologous CAR T TherapiesCompany Received Fast Track Designation for ALLO-647 for Use in Adult Patients with Relapsed/Refractory Large B-Cell Lymphoma in November 2023 SOUTH SAN FRANCISCO, Calif., Dec. 09, 2023 (GLOBE NEWSWIRE) -- Allogene Therapeutics, Inc. (Nasdaq: ALLO), a c |
Allogene Therapeutics Announces Participation in December Investor ConferenceSOUTH SAN FRANCISCO, Calif., Dec. 01, 2023 (GLOBE NEWSWIRE) -- Allogene Therapeutics, Inc. (Nasdaq: ALLO), a clinical-stage biotechnology company pioneering the development of allogeneic CAR T (AlloCAR T™) products for cancer, today announced that it will participate in one upcoming investor conference in December. The JMP Securities Hematology and Oncology SummitWednesday, December 6, 20238:30AM PT/11:30AM ET Any available webcasts will be posted to the Company's website at www.allogene.com und |
ALLO Price Returns
| 1-mo | 28.21% |
| 3-mo | 3.81% |
| 6-mo | -7.41% |
| 1-year | -36.58% |
| 3-year | -86.12% |
| 5-year | -89.78% |
| YTD | -6.54% |
| 2023 | -48.97% |
| 2022 | -57.84% |
| 2021 | -40.89% |
| 2020 | -2.85% |
| 2019 | -3.53% |


Loading social stream, please wait...