
Alnylam Pharmaceuticals Inc. (ALNY): Price and Financial Metrics
ALNY Price/Volume Stats
| Current price | $234.84 | 52-week high | $263.73 |
| Prev. close | $237.88 | 52-week low | $141.98 |
| Day low | $233.42 | Volume | 524,476 |
| Day high | $240.31 | Avg. volume | 882,296 |
| 50-day MA | $196.94 | Dividend yield | N/A |
| 200-day MA | $172.44 | Market Cap | 29.71B |
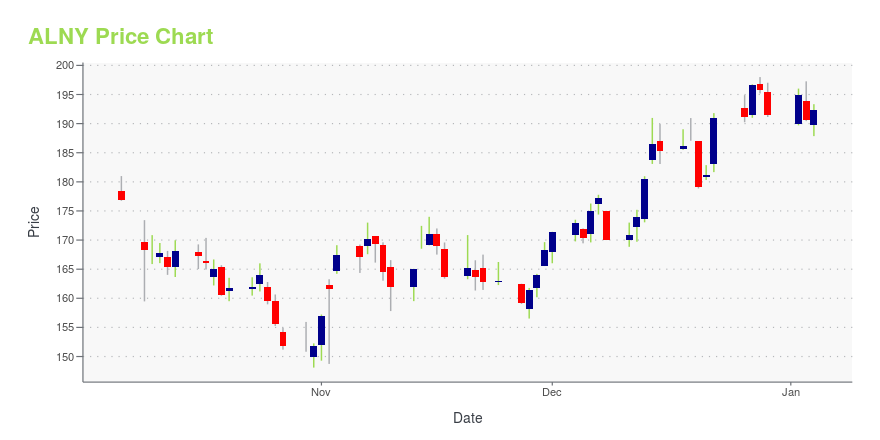
ALNY Stock Price Chart Interactive Chart >
Alnylam Pharmaceuticals Inc. (ALNY) Company Bio
Alnylam Pharmaceuticals, Inc. is an American biopharmaceutical company focused on the discovery, development and commercialization of RNA interference (RNAi) therapeutics[3] for genetically defined diseases. The company was founded in 2002 and is headquartered in Cambridge, Massachusetts.[4] In 2016, Forbes included the company on its "100 Most Innovative Growth Companies" list. (Source:Wikipedia)
Latest ALNY News From Around the Web
Below are the latest news stories about ALNYLAM PHARMACEUTICALS INC that investors may wish to consider to help them evaluate ALNY as an investment opportunity.
Ionis, Astrazeneca win FDA approval of competitor to Alnylam drugThe clearance of Wainua for transthyretin amyloidosis opens up a new front in a long-running commercial battle between Ionis and Alnylam. |
13 Most Promising Healthcare Stocks According to AnalystsIn this article, we discuss the 13 most promising healthcare stocks according to analysts. To skip the detailed overview of the healthcare sector, go directly to the 5 Most Promising Healthcare Stocks According to Analysts. The healthcare industry landscape is changing. While the COVID-19 pandemic was one of the most significant events that led to […] |
Alnylam Highlights Significant Progress with Platform Innovation and Clinical Pipeline at R&D DayCAMBRIDGE, Mass., December 13, 2023--Alnylam Pharmaceuticals, Inc. (Nasdaq: ALNY), the leading RNAi therapeutics company, is hosting a virtual R&D Day today. During the event, the Company plans to showcase its R&D progress and platform innovation, as well as its product and pipeline goals for 2024, including continued commercial execution of four RNAi therapeutic products and the advancement of early-, mid-, and late-stage investigational programs. |
Alnylam to Webcast Virtual R&D DayCAMBRIDGE, Mass., December 06, 2023--Alnylam Pharmaceuticals, Inc. (Nasdaq: ALNY), the leading RNAi therapeutics company, announced today that it will webcast its upcoming virtual R&D Day event on the Investors section of the Company’s website, www.alnylam.com, on Wednesday, December 13, 2023 at 8:30 am ET. A replay will be available on the Alnylam website within 48 hours after the event. |
Alnylam Ranks #1 on Boston Globe’s Top Places to Work List for 2023CAMBRIDGE, Mass., November 30, 2023--Alnylam Pharmaceuticals, Inc. (Nasdaq: ALNY), the leading RNAi therapeutics company, announced its first-place ranking in Boston Globe’s 2023 Top Places to Work in the "Largest Employer" category. This marks the third year in a row that Alnylam has taken the top spot in the Largest Employer category (> 1,000 employees). |
ALNY Price Returns
| 1-mo | -4.21% |
| 3-mo | 63.87% |
| 6-mo | 30.74% |
| 1-year | 20.51% |
| 3-year | 32.99% |
| 5-year | 207.54% |
| YTD | 22.69% |
| 2023 | -19.46% |
| 2022 | 40.14% |
| 2021 | 30.48% |
| 2020 | 12.85% |
| 2019 | 57.96% |
Continue Researching ALNY
Want to do more research on Alnylam Pharmaceuticals Inc's stock and its price? Try the links below:Alnylam Pharmaceuticals Inc (ALNY) Stock Price | Nasdaq
Alnylam Pharmaceuticals Inc (ALNY) Stock Quote, History and News - Yahoo Finance
Alnylam Pharmaceuticals Inc (ALNY) Stock Price and Basic Information | MarketWatch
Loading social stream, please wait...