
Alto Ingredients Inc. (ALTO): Price and Financial Metrics
ALTO Price/Volume Stats
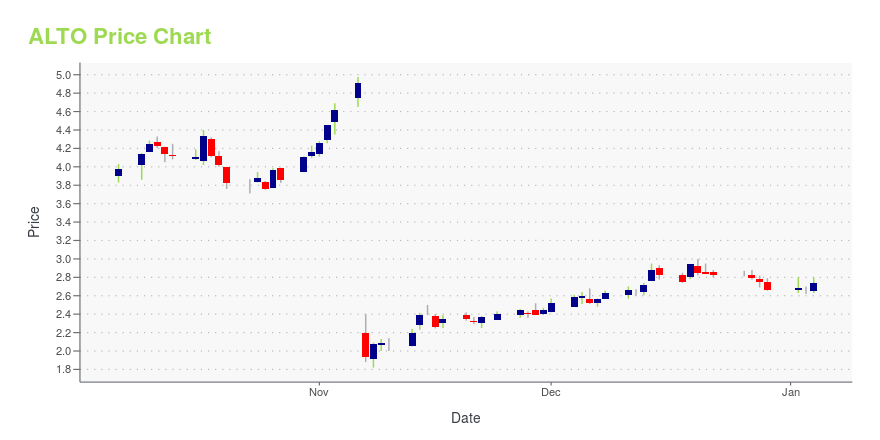
| Current price | $1.56 | 52-week high | $4.98 |
| Prev. close | $1.54 | 52-week low | $1.28 |
| Day low | $1.53 | Volume | 100,239 |
| Day high | $1.56 | Avg. volume | 548,229 |
| 50-day MA | $1.50 | Dividend yield | N/A |
| 200-day MA | $2.21 | Market Cap | 118.09M |
ALTO Stock Price Chart Interactive Chart >
Alto Ingredients Inc. (ALTO) Company Bio
Pacific Ethanol, Inc. engages in the production and marketing of carbon renewable fuel. It operates through the Ethanol Production, and Marketing and Distribution business segments. The Ethanol Production segment includes the production and sale of ethanol and co-products. The Marketing and Distribution segment comprises of the marketing and merchant trading of company-produced ethanol; and co-products and third-party ethanol. The company was founded by William L. Jones and Neil M. Koehler on January 30, 2003 and is headquartered in Sacramento, CA.
Latest ALTO News From Around the Web
Below are the latest news stories about ALTO INGREDIENTS INC that investors may wish to consider to help them evaluate ALTO as an investment opportunity.
Alto Ingredients, Inc. Publishes Sustainability SummaryPEKIN, Ill., Dec. 11, 2023 (GLOBE NEWSWIRE) -- Alto Ingredients, Inc. (NASDAQ: ALTO), a leading producer and distributor of specialty alcohols and essential ingredients, has published its inaugural Sustainability Summary outlining the company’s performance in key areas, such as environmental, health and safety, along with the strategy and vision for advancements in sustainability, responsible sourcing, and risk management. "As a renewables company, we are dedicated to implementing sustainable be |
Alto Ingredients, Inc. Extends Term Loan Commitment PeriodPEKIN, Ill., Dec. 06, 2023 (GLOBE NEWSWIRE) -- Alto Ingredients, Inc. (NASDAQ: ALTO), a leading producer and distributor of specialty alcohols and essential ingredients, announced that it has amended its $125 million senior secured term loan facility with certain funds managed by Orion Infrastructure Capital (“OIC”) to extend the commitment period for undrawn capital available under the term loan facility by one year to November 2024. No other material terms were changed. Alto Ingredients’ CFO, |
Alto Ingredients, Inc. to Participate in Upcoming ConferencesPEKIN, Ill., Nov. 08, 2023 (GLOBE NEWSWIRE) -- Alto Ingredients, Inc. (NASDAQ: ALTO), a leading producer and distributor of specialty alcohols and essential ingredients, announced that management plans to conduct one-on-one meetings at these conferences in November 2023. November 14:ROTH MKM 3rd Annual AgTech Answers Conferenceone-on-one meetings, New York November 16:14th Annual Craig-Hallum Alpha Select Conferenceone-on-one meetings, New York Presentation materials and webcast for the call can |
Ault Alliance (AULT) Stock Pops 11% on Financing AgreementAult Alliance stock is rising higher on Tuesday as investors in AULT react to the company securing $50 million from a funding agreement. |
PTON Stock Slumps as Deutsche Bank Downgrades PelotonPeloton stock is taking a beating on Tuesday after shares of PTON were downgraded and saw their price target reduced by Deutsche Bank. |
ALTO Price Returns
| 1-mo | 16.42% |
| 3-mo | -19.59% |
| 6-mo | -18.32% |
| 1-year | -60.41% |
| 3-year | -69.29% |
| 5-year | 168.97% |
| YTD | -41.35% |
| 2023 | -7.64% |
| 2022 | -40.12% |
| 2021 | -11.42% |
| 2020 | 735.38% |
| 2019 | -24.42% |
Loading social stream, please wait...