
Alexander's, Inc. (ALX): Price and Financial Metrics
ALX Price/Volume Stats
| Current price | $243.11 | 52-week high | $244.89 |
| Prev. close | $237.16 | 52-week low | $162.50 |
| Day low | $236.45 | Volume | 33,424 |
| Day high | $244.89 | Avg. volume | 10,143 |
| 50-day MA | $220.55 | Dividend yield | 7.41% |
| 200-day MA | $210.69 | Market Cap | 1.24B |
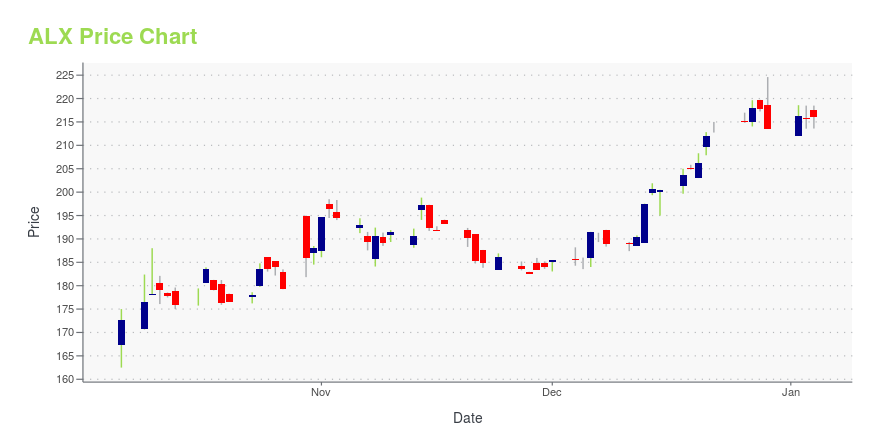
ALX Stock Price Chart Interactive Chart >
Alexander's, Inc. (ALX) Company Bio
Alexander's Inc. engages in leasing, managing, developing, and redeveloping properties in the greater New York City metropolitan area. The company was founded in 1955 and is based in Paramus, New Jersey.
Latest ALX News From Around the Web
Below are the latest news stories about ALEXANDERS INC that investors may wish to consider to help them evaluate ALX as an investment opportunity.
14 Low PE High Dividend Stocks to Buy NowIn this article, we discuss 14 low PE high-dividend stocks to buy now. You can skip our detailed analysis of value dividend stocks and their previous performance, and go directly to read 5 Low PE High Dividend Stocks to Buy Now. A low price-to-earnings (P/E) ratio suggests that the stock is undervalued relative to its […] |
Alexander’s, Inc. (NYSE:ALX) Q3 2023 Earnings Call TranscriptAlexander’s, Inc. (NYSE:ALX) Q3 2023 Earnings Call Transcript October 31, 2023 Operator: Good morning, and welcome to the Vornado Realty Trust Third Quarter 2023 Earnings Call. My name is Rocco, and I will be your operator for today’s call. This call is being recorded for replay purposes. All lines are in a listen-only mode. [Operator […] |
Alexander's Inc. (ALX) Q3 2023 Earnings Call TranscriptAlexander’s Inc. (ALX) Q3 2023 Results Conference Call October 31, 2023 10:00 AM ET Company Participants Steve Borenstein - Senior VP, Corporation Counsel and Secretary Steven Roth - Chairman of the Board and CEO Michael Franco - President and CFO Glen Weiss - Executive VP of Office Leasing and Co-Head of Real Estate Thomas Sanelli - Executive Vice President Finance and Chief Administrative Officer Conference Call Participants Steve Sakwa - Evercore ISI Camille Bonnel - BOA Michael Griffin - Citi Alex Goldfarb - Piper Sandler Dylan Burzinski - Green Street John Kim - BMO Capital Markets Anthony Paolone - JPMorgan Julien Blouin - Goldman Sachs V... |
Alexander’s Announces Third Quarter Financial ResultsPARAMUS, N.J., Oct. 30, 2023 (GLOBE NEWSWIRE) -- ALEXANDER’S, INC. (New York Stock Exchange: ALX) filed its Form 10-Q for the quarter ended September 30, 2023 today and reported: Third Quarter 2023 Financial Results Net income for the quarter ended September 30, 2023 was $10.8 million, or $2.10 per diluted share, compared to $15.1 million, or $2.95 per diluted share for the quarter ended September 30, 2022. Funds from operations (“FFO”) (non-GAAP) for the quarter ended September 30, 2023 was $18 |
Alexander’s Declares Quarterly $4.50 Dividend on Common SharesPARAMUS, N.J., Oct. 25, 2023 (GLOBE NEWSWIRE) -- Alexander’s, Inc. (NYSE: ALX) today announced that its Board of Directors has declared a regular quarterly dividend of $4.50 per share payable on November 17, 2023 to stockholders of record on November 6, 2023. Alexander’s, Inc. is a real estate investment trust that has five properties in the New York City metropolitan area. CONTACT:GARY HANSEN(201) 587-8541 Certain statements contained herein constitute forward-looking statements as such term is |
ALX Price Returns
| 1-mo | 10.48% |
| 3-mo | 19.80% |
| 6-mo | 9.99% |
| 1-year | 41.35% |
| 3-year | 9.01% |
| 5-year | -7.16% |
| YTD | 18.35% |
| 2023 | 6.35% |
| 2022 | -9.12% |
| 2021 | 0.20% |
| 2020 | -10.24% |
| 2019 | 14.13% |
ALX Dividends
| Ex-Dividend Date | Type | Payout Amount | Change | ||||||
|---|---|---|---|---|---|---|---|---|---|
| Loading, please wait... | |||||||||
Continue Researching ALX
Want to see what other sources are saying about Alexanders Inc's financials and stock price? Try the links below:Alexanders Inc (ALX) Stock Price | Nasdaq
Alexanders Inc (ALX) Stock Quote, History and News - Yahoo Finance
Alexanders Inc (ALX) Stock Price and Basic Information | MarketWatch
Loading social stream, please wait...