Ambarella Inc. (AMBA): Price and Financial Metrics
GET POWR RATINGS... FREE!
AMBA POWR Grades
- Growth is the dimension where AMBA ranks best; there it ranks ahead of 92.05% of US stocks.
- AMBA's strongest trending metric is Value; it's been moving up over the last 179 days.
- AMBA's current lowest rank is in the Stability metric (where it is better than 17.78% of US stocks).
AMBA Stock Summary
- AMBA's one year PEG ratio, measuring expected growth in earnings next year relative to current common stock price is 284.41 -- higher than 91.11% of US-listed equities with positive expected earnings growth.
- The price/operating cash flow metric for Ambarella Inc is higher than 96.64% of stocks in our set with a positive cash flow.
- The ratio of debt to operating expenses for Ambarella Inc is higher than it is for about merely 10.49% of US stocks.
- Stocks that are quantitatively similar to AMBA, based on their financial statements, market capitalization, and price volatility, are LITE, INVZ, AGYS, ARWR, and CGEM.
- AMBA's SEC filings can be seen here. And to visit Ambarella Inc's official web site, go to www.ambarella.com.
AMBA Valuation Summary
- In comparison to the median Technology stock, AMBA's price/sales ratio is 279.25% higher, now standing at 20.1.
- AMBA's price/earnings ratio has moved down 97.5 over the prior 108 months.
- AMBA's price/sales ratio has moved up 18.6 over the prior 108 months.
Below are key valuation metrics over time for AMBA.
Stock | Date | P/S | P/B | P/E | EV/EBIT |
---|---|---|---|---|---|
AMBA | 2021-09-01 | 20.1 | 9.7 | -86.8 | -87.1 |
AMBA | 2021-08-31 | 15.8 | 7.6 | -68.1 | -67.4 |
AMBA | 2021-08-30 | 16.0 | 7.8 | -69.4 | -68.8 |
AMBA | 2021-08-27 | 15.6 | 7.6 | -67.4 | -66.7 |
AMBA | 2021-08-26 | 14.9 | 7.3 | -64.6 | -63.8 |
AMBA | 2021-08-25 | 15.1 | 7.3 | -65.3 | -64.4 |
AMBA Growth Metrics
- Its year over year net income to common stockholders growth rate is now at -28.4%.
- Its 2 year net cashflow from operations growth rate is now at -33.19%.
- Its 4 year net income to common stockholders growth rate is now at -172.25%.

The table below shows AMBA's growth in key financial areas (numbers in millions of US dollars).
Date | Revenue | Operating Cash Flow | Net Income to Common Stock |
---|---|---|---|
2021-09-30 | 303.769 | 30.708 | -29.707 |
2021-06-30 | 267.692 | 35.468 | -47.541 |
2021-03-31 | 238.478 | 18.614 | -55.141 |
2020-12-31 | 222.99 | 30.8 | -59.786 |
2020-09-30 | 218.06 | 22.446 | -60.278 |
2020-06-30 | 229.892 | 31.217 | -47.509 |
AMBA's Quality Factors
The “Quality” component of the POWR Ratings focuses on 31 different factors of a companies fundamentals and operational strength. Here are some key insights as we drill into the specifics of these quality attributes.- AMBA has a Quality Grade of C, ranking ahead of 59.26% of graded US stocks.
- AMBA's asset turnover comes in at 0.462 -- ranking 152nd of 208 Electronic Equipment stocks.
- MEI, KE, and TTMI are the stocks whose asset turnover ratios are most correlated with AMBA.
The table below shows AMBA's key quality metrics over time.
Period | Asset Turnover | Gross Margin | ROIC |
---|---|---|---|
2021-07-31 | 0.462 | 0.619 | -0.188 |
2021-04-30 | 0.426 | 0.618 | -0.225 |
2021-01-31 | 0.408 | 0.608 | -0.258 |
2020-10-31 | 0.407 | 0.601 | -0.257 |
2020-07-31 | 0.436 | 0.589 | -0.219 |
2020-04-30 | 0.458 | 0.580 | -0.200 |
AMBA Price Target
For more insight on analysts targets of AMBA, see our AMBA price target page. And for a list of of all stocks sorted by upside potential based on analyst target price, see our Top Price Target page.
Average Price Target | $142.80 | Average Broker Recommendation | 1.61 (Moderate Buy) |
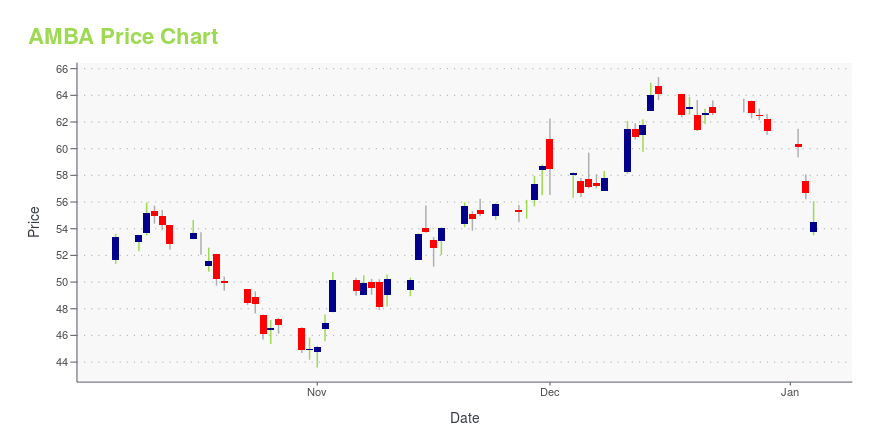
AMBA Stock Price Chart Interactive Chart >
AMBA Price/Volume Stats
Current price | $81.27 | 52-week high | $227.59 |
Prev. close | $76.36 | 52-week low | $65.60 |
Day low | $77.61 | Volume | 594,500 |
Day high | $82.51 | Avg. volume | 770,174 |
50-day MA | $88.84 | Dividend yield | N/A |
200-day MA | $138.53 | Market Cap | 3.09B |
Ambarella Inc. (AMBA) Company Bio
Ambarella Inc. is a developer of low-power, high-definition (HD) and Ultra HD video compression and image processing solutions. The company's products are used in a variety of HD cameras including security IP-cameras, sports cameras, wearable cameras, flying cameras and automotive video camera recorders. The company was founded in 2004 and is based in Santa Clara, California.
Latest AMBA News From Around the Web
Below are the latest news stories about Ambarella Inc that investors may wish to consider to help them evaluate AMBA as an investment opportunity.
Should You Buy Ambarella (AMBA) Ahead of Earnings?Ambarella (AMBA) is seeing favorable earnings estimate revision activity and has a positive Zacks Earnings ESP heading into earnings season. |
Arlo Technologies (ARLO) to Report Q4 Earnings: What to Expect?Arlo Technologies (ARLO) fourth-quarter results are likely to benefit from growing subscriber base. |
What's in the Offing for Ambarella (AMBA) in Q4 Earnings?Along with a favorable pricing environment, Ambarella's (AMBA) Q4 results are likely to reflect the benefits from strong demand for its consumer security, automotive and Internet of Things camera businesses. |
7 Analyst Upgrades That Smart Stock Investors Won’t IgnoreIn light of a new market that no longer favors expensive growth stories, here are seven analyst upgrades for long-term investors. |
7 Semiconductor Stocks Smart Investors Will Buy Before They ReboundThe supply chain issues that shook semiconductor stocks are slowly getting better, and the outlook looks much brighter now. |
AMBA Price Returns
1-mo | N/A |
3-mo | -45.05% |
6-mo | -57.19% |
1-year | -7.72% |
3-year | 78.93% |
5-year | 33.03% |
YTD | -59.94% |
2021 | 120.96% |
2020 | 51.62% |
2019 | 73.13% |
2018 | -40.46% |
2017 | 8.54% |
Continue Researching AMBA
Want to see what other sources are saying about Ambarella Inc's financials and stock price? Try the links below:Ambarella Inc (AMBA) Stock Price | Nasdaq
Ambarella Inc (AMBA) Stock Quote, History and News - Yahoo Finance
Ambarella Inc (AMBA) Stock Price and Basic Information | MarketWatch
Loading social stream, please wait...