AMN Healthcare Services Inc. (AMN): Price and Financial Metrics

AMN Healthcare Services Inc. (AMN): $67.31

0.98 (-1.44%)

POWR Rating

Component Grades

Momentum

C

Stability

D

Sentiment

Quality

B

Add AMN to Watchlist
Sign Up

Industry: Medical - Services

Industry

C

Ranked

#30 of 65

in industry

AMN Price/Volume Stats

Current price $67.31 52-week high $124.86
Prev. close $68.29 52-week low $57.80
Day low $65.68 Volume 284,356
Day high $68.09 Avg. volume 694,387
50-day MA $73.23 Dividend yield N/A
200-day MA $88.73 Market Cap 2.54B

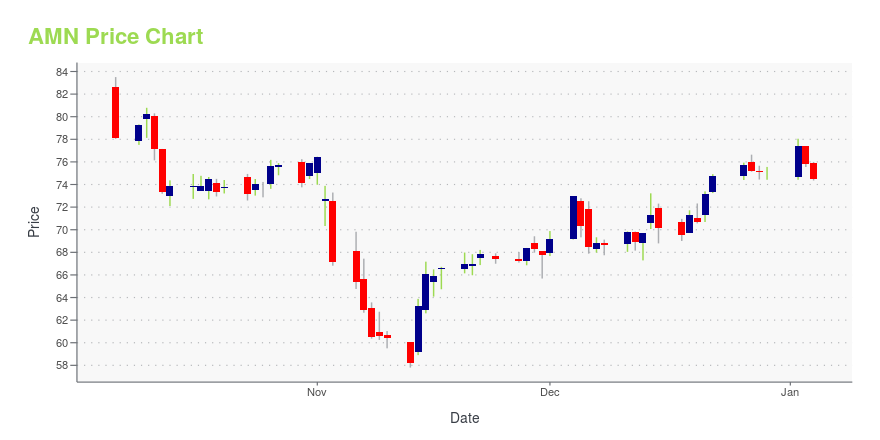
AMN Stock Price Chart Interactive Chart >

AMN POWR Grades

  • Value is the dimension where AMN ranks best; there it ranks ahead of 93.38% of US stocks.
  • The strongest trend for AMN is in Stability, which has been heading down over the past 177 days.
  • AMN ranks lowest in Sentiment; there it ranks in the 5th percentile.

AMN Stock Summary

  • AMN HEALTHCARE SERVICES INC's capital turnover -- a measure of revenue relative to shareholder's equity -- is better than 90.96% of US listed stocks.
  • As for revenue growth, note that AMN's revenue has grown -25.26% over the past 12 months; that beats the revenue growth of just 10.74% of US companies in our set.
  • AMN HEALTHCARE SERVICES INC's shareholder yield -- a measure of how much capital is returned to stockholders via dividends and buybacks -- is 22.25%, greater than the shareholder yield of 91.28% of stocks in our set.
  • Stocks with similar financial metrics, market capitalization, and price volatility to AMN HEALTHCARE SERVICES INC are BCC, FL, PATK, THRY, and THO.
  • AMN's SEC filings can be seen here. And to visit AMN HEALTHCARE SERVICES INC's official web site, go to www.amnhealthcare.com.

AMN Valuation Summary

  • AMN's price/earnings ratio is 8; this is 67.08% lower than that of the median Healthcare stock.
  • Over the past 243 months, AMN's price/earnings ratio has gone down 2.6.

Below are key valuation metrics over time for AMN.

Stock Date P/S P/B P/E EV/EBIT
AMN 2023-11-03 0.6 3.3 8.0 7.4
AMN 2023-11-02 0.6 3.6 8.7 7.9
AMN 2023-11-01 0.7 3.8 9.1 8.2
AMN 2023-10-31 0.7 3.8 9.0 8.1
AMN 2023-10-30 0.6 3.7 8.8 8.0
AMN 2023-10-27 0.7 3.8 9.0 8.1

AMN Growth Metrics

    Its 2 year net cashflow from operations growth rate is now at 94.34%.
  • Its 5 year net income to common stockholders growth rate is now at -17.1%.
  • The 5 year cash and equivalents growth rate now stands at 136.91%.
AMN's revenue has moved up $2,951,115,000 over the prior 34 months.

The table below shows AMN's growth in key financial areas (numbers in millions of US dollars).

Date Revenue Operating Cash Flow Net Income to Common Stock
2022-12-31 5,243.242 653.733 444.05
2022-09-30 5,480.776 616.39 478.47
2022-06-30 5,219.99 519.408 460.048
2022-03-31 4,650.828 466.44 403.018
2021-12-31 3,984.235 305.356 327.388
2021-09-30 3,252.461 267.216 220.479

AMN's Quality Factors

The “Quality” component of the POWR Ratings focuses on 31 different factors of a companies fundamentals and operational strength. Here are some key insights as we drill into the specifics of these quality attributes.
  • AMN has a Quality Grade of C, ranking ahead of 69.2% of graded US stocks.
  • AMN's asset turnover comes in at 1.174 -- ranking 92nd of 563 Business Services stocks.
  • AVID, CRTO, and DHX are the stocks whose asset turnover ratios are most correlated with AMN.

The table below shows AMN's key quality metrics over time.

Period Asset Turnover Gross Margin ROIC
2021-06-30 1.174 0.329 0.200
2021-03-31 1.103 0.328 0.153
2020-12-31 1.005 0.331 0.102
2020-09-30 1.033 0.333 0.119
2020-06-30 1.098 0.333 0.119
2020-03-31 1.131 0.335 0.130

AMN Price Target

For more insight on analysts targets of AMN, see our AMN price target page. And for a list of of all stocks sorted by upside potential based on analyst target price, see our Top Price Target page.

Average Price Target $121.78 Average Broker Recommendation 1.35 (Strong Buy)

AMN Healthcare Services Inc. (AMN) Company Bio


AMN Healthcare Services provides healthcare workforce solutions and staffing services to healthcare facilities in the United States. It operates through three segments: Nurse and Allied Healthcare Staffing, Locum Tenens Staffing, and Physician Permanent Placement Services. The company was founded in 1985 and is based in San Diego, California.


AMN Latest News Stream


Event/Time News Detail
Loading, please wait...

AMN Latest Social Stream


Loading social stream, please wait...

View Full AMN Social Stream

Latest AMN News From Around the Web

Below are the latest news stories about AMN HEALTHCARE SERVICES INC that investors may wish to consider to help them evaluate AMN as an investment opportunity.

7 Elder Care Stocks to Take Advantage of Aging America

Buy these seven elder care stocks, as each one has ample exposure to the long-term "graying of America" trend.

Thomas Niel on InvestorPlace | November 22, 2023

Implied Volatility Surging for AMN Healthcare (AMN) Stock Options

Investors need to pay close attention to AMN Healthcare (AMN) stock based on the movements in the options market lately.

Yahoo | November 17, 2023

AMN Healthcare Study Tracks 45 Languages Spoken in Patient/Provider Encounters in U.S.

Analysis of 204 million minutes of patient interpretation services underscores the ever-increasing complexity in navigating patient, provider encounters nationwideDALLAS, Nov. 14, 2023 (GLOBE NEWSWIRE) -- Patient/provider encounters in the United States are conducted in an increasingly diverse set of languages beyond English and Spanish, according to the 2023 Healthcare World Languages Index compiled by AMN Healthcare, a leading healthcare talent acquisition and technology company, which tracked

Yahoo | November 14, 2023

Q3 2023 AMN Healthcare Services Inc Earnings Call

Q3 2023 AMN Healthcare Services Inc Earnings Call

Yahoo | November 3, 2023

AMN Healthcare (AMN) Q3 Earnings and Revenues Beat Estimates

AMN Healthcare's (AMN) dismal results in all its segments led to a soft overall third-quarter performance.

Yahoo | November 3, 2023

Read More 'AMN' Stories Here

AMN Price Returns

1-mo -11.27%
3-mo -23.17%
6-mo -32.41%
1-year -45.59%
3-year 3.30%
5-year 5.67%
YTD -34.54%
2022 -15.95%
2021 79.24%
2020 9.53%
2019 9.97%
2018 15.05%

Continue Researching AMN

Want to see what other sources are saying about Amn Healthcare Services Inc's financials and stock price? Try the links below:

Amn Healthcare Services Inc (AMN) Stock Price | Nasdaq
Amn Healthcare Services Inc (AMN) Stock Quote, History and News - Yahoo Finance
Amn Healthcare Services Inc (AMN) Stock Price and Basic Information | MarketWatch

Get Free Updates

Join thousands of investors who get the latest news, insights and top rated picks from StockNews.com!