Ameriprise Financial Inc. (AMP): Price and Financial Metrics


Ameriprise Financial Inc. (AMP): $290.00

-7.16 (-2.41%)

POWR Rating

Component Grades

Growth

S

Value

I

Momentum

G

Stability

N

Sentiment

U

Quality

P

AMP POWR Grades

  • Momentum is the dimension where AMP ranks best; there it ranks ahead of 96.57% of US stocks.
  • AMP's strongest trending metric is Momentum; it's been moving up over the last 179 days.
  • AMP ranks lowest in Quality; there it ranks in the 28th percentile.

AMP Stock Summary

  • AMP has a market capitalization of $31,187,956,718 -- more than approximately 92.77% of US stocks.
  • AMERIPRISE FINANCIAL INC's capital turnover -- a measure of revenue relative to shareholder's equity -- is better than 87.7% of US listed stocks.
  • AMP's equity multiplier -- a measure of assets relative to shareholders'equity -- is greater than that of 99.18% of US stocks.
  • Stocks that are quantitatively similar to AMP, based on their financial statements, market capitalization, and price volatility, are PRU, PFG, OMC, AEG, and VOYA.
  • Visit AMP's SEC page to see the company's official filings. To visit the company's web site, go to www.ameriprise.com.

AMP Valuation Summary

  • AMP's price/sales ratio is 2.1; this is 110% higher than that of the median Financial Services stock.
  • AMP's price/earnings ratio has moved down 0.1 over the prior 213 months.

Below are key valuation metrics over time for AMP.

Stock Date P/S P/B P/E EV/EBIT
AMP 2023-03-17 2.1 8.2 11.6 7.6
AMP 2023-03-16 2.1 8.4 11.9 7.8
AMP 2023-03-15 2.1 8.3 11.7 7.7
AMP 2023-03-14 2.2 8.7 12.2 8.1
AMP 2023-03-13 2.1 8.4 11.8 7.8
AMP 2023-03-10 2.2 8.8 12.4 8.2

AMP Growth Metrics

    Its 5 year net income to common stockholders growth rate is now at 161.2%.
  • The 4 year revenue growth rate now stands at 8.6%.
  • Its 4 year cash and equivalents growth rate is now at 109.27%.
Over the past 34 months, AMP's revenue has gone up $1,421,000,000.

The table below shows AMP's growth in key financial areas (numbers in millions of US dollars).

Date Revenue Operating Cash Flow Net Income to Common Stock
2022-12-31 14,271 4,407 2,559
2022-09-30 14,414 4,741 2,766
2022-06-30 13,826 4,212 3,249
2022-03-31 13,736 4,734 3,084
2021-12-31 13,431 3,325 2,760
2021-09-30 12,854 758 2,236

AMP's Quality Factors

The “Quality” component of the POWR Ratings focuses on 31 different factors of a companies fundamentals and operational strength. Here are some key insights as we drill into the specifics of these quality attributes.
  • AMP has a Quality Grade of D, ranking ahead of 18.75% of graded US stocks.
  • AMP's asset turnover comes in at 0.078 -- ranking 261st of 443 Trading stocks.
  • EPR, PEI, and RJF are the stocks whose asset turnover ratios are most correlated with AMP.

The table below shows AMP's key quality metrics over time.

Period Asset Turnover Gross Margin ROIC
2021-06-30 0.078 0.757 0.012
2021-03-31 0.076 0.657 0.005
2020-12-31 0.076 0.848 0.018
2020-09-30 0.079 0.871 0.020
2020-06-30 0.082 0.915 0.026
2020-03-31 0.086 0.988 0.033

AMP Price Target

For more insight on analysts targets of AMP, see our AMP price target page. And for a list of of all stocks sorted by upside potential based on analyst target price, see our Top Price Target page.

Average Price Target $292.50 Average Broker Recommendation 1.42 (Moderate Buy)

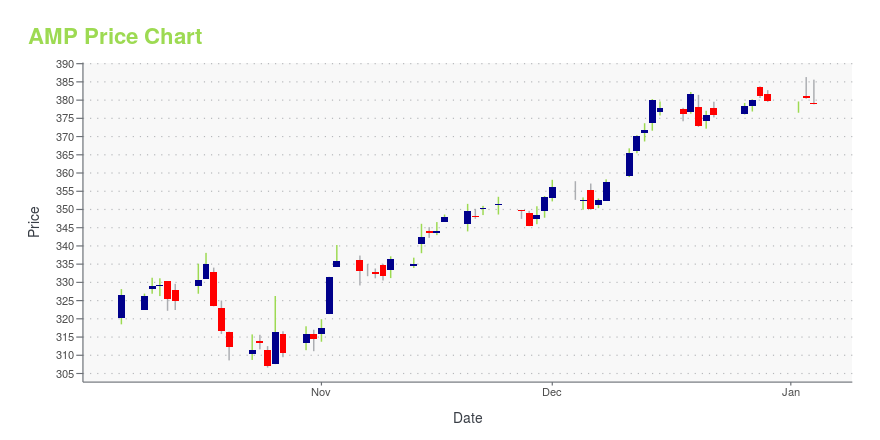
AMP Stock Price Chart Interactive Chart >

Price chart for AMP

AMP Price/Volume Stats

Current price $290.00 52-week high $357.46
Prev. close $297.16 52-week low $219.99
Day low $290.00 Volume 232
Day high $290.00 Avg. volume 616,371
50-day MA $331.61 Dividend yield 1.69%
200-day MA $293.96 Market Cap 30.49B

Ameriprise Financial Inc. (AMP) Company Bio


Ameriprise Financial, Inc. is a diversified financial services company and bank holding company incorporated in Delaware and headquartered in Minneapolis, Minnesota. It provides financial planning products and services, including wealth managementasset managementinsuranceannuities, and estate planning (Source:Wikipedia)


AMP Latest News Stream


Event/Time News Detail
Loading, please wait...

AMP Latest Social Stream


Loading social stream, please wait...

View Full AMP Social Stream

Latest AMP News From Around the Web

Below are the latest news stories about AMERIPRISE FINANCIAL INC that investors may wish to consider to help them evaluate AMP as an investment opportunity.

Is Ameriprise Financial (AMP) Stock Undervalued Right Now?

Here at Zacks, our focus is on the proven Zacks Rank system, which emphasizes earnings estimates and estimate revisions to find great stocks. Nevertheless, we are always paying attention to the latest value, growth, and momentum trends to underscore strong picks.

Yahoo | March 23, 2023

67 Ameriprise Financial Advisors Named to the Barron’s "Top 1,200 Financial Advisors" List

MINNEAPOLIS, March 22, 2023--Ameriprise Financial, Inc. (NYSE: AMP), today announced that 67 of its financial advisors were named to the 2023 Barron’s "Top 1,200 Financial Advisors" list. Barron’s recognizes the industry’s top advisors according to several factors including levels of ethical standards, professionalism and success in the business. The rankings are based on data provided by more than 4,000 of the nation’s most productive advisors.

Yahoo | March 22, 2023

Possible bearish signals as Ameriprise Financial, Inc. (NYSE:AMP) insiders disposed of US$45m worth of stock

In the last year, many Ameriprise Financial, Inc. ( NYSE:AMP ) insiders sold a substantial stake in the company which...

Yahoo | March 21, 2023

Scoop up These 4 GARP Stocks to Get Handsome Returns

The GARP strategy helps investors gain exposure to stocks that boast impressive prospects and are trading at a discount. AMP, GWW, EWBC and BLMN are some stocks that hold promise.

Yahoo | March 16, 2023

The Zacks Analyst Blog Highlights Ameriprise Financial, Everest Re Group, Microchip Technology, Henry Schein and HSBC Holdings

Ameriprise Financial, Everest Re Group, Microchip Technology, Henry Schein and HSBC Holdings are part of the Zacks top Analyst Blog.

Yahoo | March 15, 2023

Read More 'AMP' Stories Here

AMP Price Returns

1-mo -14.54%
3-mo -5.59%
6-mo 13.54%
1-year -5.38%
3-year 207.39%
5-year 123.76%
YTD -6.53%
2022 4.98%
2021 57.92%
2020 19.82%
2019 63.96%
2018 -36.83%

AMP Dividends

Ex-Dividend Date Type Payout Amount Change
Loading, please wait...
View Full AMP Dividend History

Continue Researching AMP

Want to see what other sources are saying about Ameriprise Financial Inc's financials and stock price? Try the links below:

Ameriprise Financial Inc (AMP) Stock Price | Nasdaq
Ameriprise Financial Inc (AMP) Stock Quote, History and News - Yahoo Finance
Ameriprise Financial Inc (AMP) Stock Price and Basic Information | MarketWatch

Get Free Updates

Join thousands of investors who get the latest news, insights and top rated picks from StockNews.com!


Page generated in 0.7858 seconds.