Amphastar Pharmaceuticals, Inc. (AMPH): Price and Financial Metrics
GET POWR RATINGS... FREE!
AMPH POWR Grades
- Growth is the dimension where AMPH ranks best; there it ranks ahead of 93.76% of US stocks.
- AMPH's strongest trending metric is Stability; it's been moving down over the last 179 days.
- AMPH ranks lowest in Momentum; there it ranks in the 8th percentile.
AMPH Stock Summary
- AMPH's one year PEG ratio, measuring expected growth in earnings next year relative to current common stock price is 1.89 -- higher than just 8.58% of US-listed equities with positive expected earnings growth.
- With a year-over-year growth in debt of 55.59%, Amphastar Pharmaceuticals Inc's debt growth rate surpasses 84.69% of about US stocks.
- Over the past twelve months, AMPH has reported earnings growth of 1,472.9%, putting it ahead of 98.51% of US stocks in our set.
- Stocks that are quantitatively similar to AMPH, based on their financial statements, market capitalization, and price volatility, are AOSL, SMTC, FORM, KOPN, and PSNL.
- AMPH's SEC filings can be seen here. And to visit Amphastar Pharmaceuticals Inc's official web site, go to www.amphastar.com.
AMPH Valuation Summary
- AMPH's EV/EBIT ratio is 46.7; this is 59.39% higher than that of the median Healthcare stock.
- AMPH's EV/EBIT ratio has moved up 19.7 over the prior 87 months.
- Over the past 87 months, AMPH's price/sales ratio has gone up 0.8.
Below are key valuation metrics over time for AMPH.
Stock | Date | P/S | P/B | P/E | EV/EBIT |
---|---|---|---|---|---|
AMPH | 2021-08-31 | 2.5 | 2.2 | 90.3 | 46.7 |
AMPH | 2021-08-30 | 2.4 | 2.2 | 89.0 | 45.9 |
AMPH | 2021-08-27 | 2.4 | 2.2 | 88.7 | 45.7 |
AMPH | 2021-08-26 | 2.4 | 2.2 | 86.8 | 44.7 |
AMPH | 2021-08-25 | 2.4 | 2.1 | 86.7 | 44.6 |
AMPH | 2021-08-24 | 2.4 | 2.2 | 88.3 | 45.5 |
AMPH Growth Metrics
- Its 5 year net cashflow from operations growth rate is now at 101.3%.
- Its year over year revenue growth rate is now at 12.5%.
- The year over year cash and equivalents growth rate now stands at 79.57%.

The table below shows AMPH's growth in key financial areas (numbers in millions of US dollars).
Date | Revenue | Operating Cash Flow | Net Income to Common Stock |
---|---|---|---|
2021-12-31 | 437.768 | 97.994 | 62.116 |
2021-09-30 | 412.802 | 74.446 | 36.083 |
2021-06-30 | 384.035 | 80.684 | 10.454 |
2021-03-31 | 368.178 | 78.614 | 2.495 |
2020-12-31 | 349.846 | 57.266 | 1.403 |
2020-09-30 | 337.308 | 46.025 | 6.65 |
AMPH's Quality Factors
The “Quality” component of the POWR Ratings focuses on 31 different factors of a companies fundamentals and operational strength. Here are some key insights as we drill into the specifics of these quality attributes.- AMPH has a Quality Grade of C, ranking ahead of 66.19% of graded US stocks.
- AMPH's asset turnover comes in at 0.601 -- ranking 59th of 680 Pharmaceutical Products stocks.
- VTVT, MTEX, and BBI are the stocks whose asset turnover ratios are most correlated with AMPH.
The table below shows AMPH's key quality metrics over time.
Period | Asset Turnover | Gross Margin | ROIC |
---|---|---|---|
2021-06-30 | 0.601 | 0.431 | 0.042 |
2021-03-31 | 0.591 | 0.411 | 0.012 |
2020-12-31 | 0.579 | 0.410 | 0.012 |
2020-09-30 | 0.568 | 0.415 | 0.026 |
2020-06-30 | 0.570 | 0.415 | 0.017 |
2020-03-31 | 0.558 | 0.421 | 0.160 |
AMPH Price Target
For more insight on analysts targets of AMPH, see our AMPH price target page. And for a list of of all stocks sorted by upside potential based on analyst target price, see our Top Price Target page.
Average Price Target | $22.75 | Average Broker Recommendation | 1.75 (Moderate Buy) |
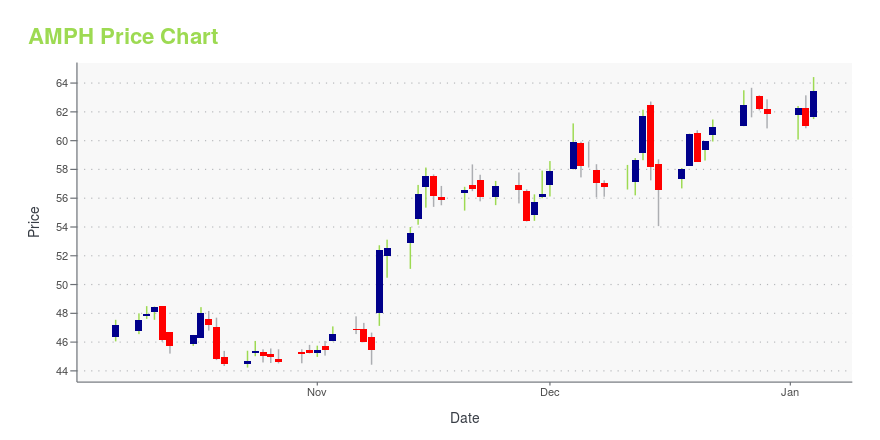
AMPH Stock Price Chart Interactive Chart >
AMPH Price/Volume Stats
Current price | $35.28 | 52-week high | $44.46 |
Prev. close | $34.66 | 52-week low | $17.56 |
Day low | $34.44 | Volume | 415,400 |
Day high | $35.98 | Avg. volume | 506,241 |
50-day MA | $34.54 | Dividend yield | N/A |
200-day MA | $27.77 | Market Cap | 1.72B |
Amphastar Pharmaceuticals, Inc. (AMPH) Company Bio
Amphastar Pharmaceuticals focuses on the development, manufacture, marketing, and sale of generic and proprietary injectable and inhalation products. It operates in two segments, Finished Pharmaceutical Products and Active Pharmaceutical Ingredients. The company was founded in 1996 and is based in Rancho Cucamonga, California.
Latest AMPH News From Around the Web
Below are the latest news stories about Amphastar Pharmaceuticals Inc that investors may wish to consider to help them evaluate AMPH as an investment opportunity.
Amphastar Pharmaceuticals, Inc.'s (NASDAQ:AMPH) Stock On An Uptrend: Could Fundamentals Be Driving The Momentum?Amphastar Pharmaceuticals' (NASDAQ:AMPH) stock is up by a considerable 24% over the past three months. We wonder if and... |
10 Best Pharmaceutical Stocks to Buy in 2022In this article, we discuss the 10 best pharmaceutical stocks to buy in 2022. If you want to skip our detailed analysis of the pharmaceutical industry and these stocks, go directly to 5 Best Pharmaceutical Stocks to Buy in 2022. In a post-COVID world, pharmaceutical and biotech companies will be expected to make larger strides […] |
7 Safe Stocks to Rely On When the Market SwervesWhen markets that have flown so high for so long start to tumble, along with an economy that transitioning, safe stocks are essential. |
Is Amphastar Pharmaceuticals (AMPH) a Suitable Value Pick Now?Let's see if Amphastar Pharmaceuticals, Inc. (AMPH) stock is a good choice for value-oriented investors right now, or if investors subscribing to this methodology should look elsewhere for top picks. |
Amphastar Pharma: A Well-Run, Diversified Mid CapIntroduction Amphastar (AMPH) is a diversified biotech company that both has several existing products with growing sales and a number of promising drugs in various stages of development. Company WebsiteThey focus in the areas of diabetes, asthma, pain management, and opioid overdose. Some of their notable products ordinary people might... |
AMPH Price Returns
1-mo | -14.80% |
3-mo | -14.29% |
6-mo | 40.84% |
1-year | 73.37% |
3-year | 73.54% |
5-year | 94.92% |
YTD | 51.48% |
2021 | 15.81% |
2020 | 4.25% |
2019 | -3.07% |
2018 | 3.43% |
2017 | 4.45% |
Continue Researching AMPH
Want to see what other sources are saying about Amphastar Pharmaceuticals Inc's financials and stock price? Try the links below:Amphastar Pharmaceuticals Inc (AMPH) Stock Price | Nasdaq
Amphastar Pharmaceuticals Inc (AMPH) Stock Quote, History and News - Yahoo Finance
Amphastar Pharmaceuticals Inc (AMPH) Stock Price and Basic Information | MarketWatch
Loading social stream, please wait...