
Ameresco, Inc. (AMRC): Price and Financial Metrics
AMRC Price/Volume Stats
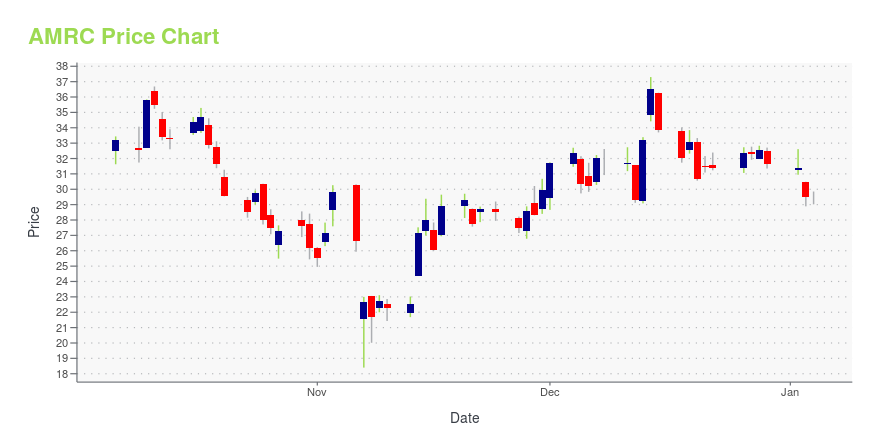
| Current price | $30.89 | 52-week high | $59.66 |
| Prev. close | $32.31 | 52-week low | $17.55 |
| Day low | $30.85 | Volume | 521,803 |
| Day high | $34.65 | Avg. volume | 535,017 |
| 50-day MA | $31.71 | Dividend yield | N/A |
| 200-day MA | $26.86 | Market Cap | 1.62B |
AMRC Stock Price Chart Interactive Chart >
Ameresco, Inc. (AMRC) Company Bio
Ameresco, Inc. provides comprehensive services, energy efficiency, infrastructure upgrades, asset sustainability, and renewable energy solutions for businesses and organizations in North America and Europe. The company was founded in 2000 and is based in Framingham, Massachusetts.
Latest AMRC News From Around the Web
Below are the latest news stories about AMERESCO INC that investors may wish to consider to help them evaluate AMRC as an investment opportunity.
Ameresco wins Large Company of the Year Gold Award at the 2023 Best in Biz AwardsFRAMINGHAM, Mass., December 20, 2023--Ameresco, Inc., (NYSE: AMRC), a leading cleantech integrator specializing in energy efficiency and renewable energy, today announced it has won the Company of the Year Award (Large - 1000 and more employees) gold award at the 2023 Best in Biz Awards. The Best in Biz Awards is an independent awards program that celebrates the achievements of executives, employees, teams, company performance, products and services. Winners are determined by independent judging |
What You Can Learn From Ameresco, Inc.'s (NYSE:AMRC) P/EWith a price-to-earnings (or "P/E") ratio of 38x Ameresco, Inc. ( NYSE:AMRC ) may be sending very bearish signals at... |
Ameresco secures award for two clean energy projects totaling 111MW from Hawaiian ElectricMore on Ameresco |
Hawaiian Electric Company Announces Ameresco Award for Two Clean Energy Projects Totaling 111 MWFRAMINGHAM, Mass. & O’AHU, Hawaii, December 11, 2023--Ameresco, Inc. (NYSE:AMRC), a leading clean technology integrator specializing in energy resiliency, today announced that it has been selected in Hawaiian Electric Company’s clean energy procurement initiative to bring a cleaner and more resilient energy supply to Hawaii. Ameresco was awarded two clean energy facilities located on the island of O‘ahu. The Pu`uloa Energy installation is designed to generate 99 megawatts (MW) of firm renewable |
Ameresco (AMRC), Sunel to Co-Build 300MW Projects Across UKAmeresco (AMRC) begins the construction of 300 MW solar projects in the UK in a joint effort with Sunel Group. |
AMRC Price Returns
| 1-mo | 0.52% |
| 3-mo | 43.81% |
| 6-mo | 39.96% |
| 1-year | -45.41% |
| 3-year | -52.11% |
| 5-year | 116.01% |
| YTD | -2.46% |
| 2023 | -44.57% |
| 2022 | -29.84% |
| 2021 | 55.90% |
| 2020 | 198.51% |
| 2019 | 24.11% |
Continue Researching AMRC
Want to do more research on Ameresco Inc's stock and its price? Try the links below:Ameresco Inc (AMRC) Stock Price | Nasdaq
Ameresco Inc (AMRC) Stock Quote, History and News - Yahoo Finance
Ameresco Inc (AMRC) Stock Price and Basic Information | MarketWatch
Loading social stream, please wait...