Amyris, Inc. (AMRS): Price and Financial Metrics

Amyris, Inc. (AMRS): $0.05

0.01 (-21.88%)

POWR Rating

Component Grades

Momentum

C

Stability

D

Sentiment

Quality

F

Add AMRS to Watchlist
Sign Up

Industry: Chemicals

Industry

C

Ranked

#77 of 84

in industry

AMRS Price/Volume Stats
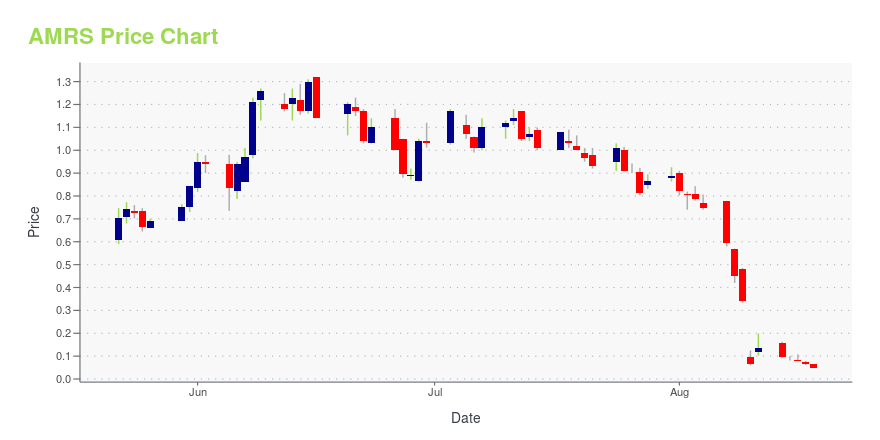
Current price $0.05 52-week high $4.86
Prev. close $0.06 52-week low $0.05
Day low $0.05 Volume 46,746,000
Day high $0.06 Avg. volume 12,593,118
50-day MA $0.86 Dividend yield N/A
200-day MA $1.28 Market Cap 18.47M

AMRS Stock Price Chart Interactive Chart >

AMRS POWR Grades

  • Growth is the dimension where AMRS ranks best; there it ranks ahead of 88.42% of US stocks.
  • The strongest trend for AMRS is in Growth, which has been heading up over the past 169 days.
  • AMRS's current lowest rank is in the Sentiment metric (where it is better than 2.59% of US stocks).

AMRS Stock Summary

  • With a price/sales ratio of 0.09, AMYRIS INC has a higher such ratio than merely 1.78% of stocks in our set.
  • In terms of twelve month growth in earnings before interest and taxes, AMYRIS INC is reporting a growth rate of 724.21%; that's higher than 97.61% of US stocks.
  • Shareholder yield, a measure of how much is returned to shareholders via dividends and share repurchases, for AMRS comes in at -1,116.46% -- higher than that of only 0.37% of stocks in our set.
  • If you're looking for stocks that are quantitatively similar to AMYRIS INC, a group of peers worth examining would be HBIO, TRIP, AZYO, VISL, and FNA.
  • Visit AMRS's SEC page to see the company's official filings. To visit the company's web site, go to www.amyris.com.

AMRS Valuation Summary

  • AMRS's EV/EBIT ratio is -1.8; this is 112.2% lower than that of the median Basic Materials stock.
  • Over the past 157 months, AMRS's price/sales ratio has gone down 9.7.

Below are key valuation metrics over time for AMRS.

Stock Date P/S P/B P/E EV/EBIT
AMRS 2023-08-14 0.1 -0.1 -0.1 -1.8
AMRS 2023-08-11 0.2 -0.1 -0.1 -1.8
AMRS 2023-08-10 0.1 0.0 0.0 -1.8
AMRS 2023-08-09 0.5 -0.2 -0.2 -2.0
AMRS 2023-08-08 0.6 -0.3 -0.3 -2.0
AMRS 2023-08-07 0.8 -0.3 -0.4 -2.1

AMRS Growth Metrics

    The year over year cash and equivalents growth rate now stands at 99.9%.
  • Its 5 year net income to common stockholders growth rate is now at -145.56%.
  • The 5 year net cashflow from operations growth rate now stands at -97.97%.
AMRS's revenue has moved up $107,844,000 over the prior 52 months.

The table below shows AMRS's growth in key financial areas (numbers in millions of US dollars).

Date Revenue Operating Cash Flow Net Income to Common Stock
2022-09-30 258.821 -575.187 -341.148
2022-06-30 235.558 -511.021 -212.697
2022-03-31 222.667 -442.426 -87.316
2021-12-31 341.817 -181.333 -270.462
2021-09-30 356.785 -49.103 -415.835
2021-06-30 343.177 -35.216 -466.366

AMRS's Quality Factors

The “Quality” component of the POWR Ratings focuses on 31 different factors of a companies fundamentals and operational strength. Here are some key insights as we drill into the specifics of these quality attributes.
  • AMRS has a Quality Grade of C, ranking ahead of 43.65% of graded US stocks.
  • AMRS's asset turnover comes in at 1.143 -- ranking 10th of 89 Chemicals stocks.
  • MBII, SNES, and FTK are the stocks whose asset turnover ratios are most correlated with AMRS.

The table below shows AMRS's key quality metrics over time.

Period Asset Turnover Gross Margin ROIC
2021-06-30 1.143 0.691 -0.949
2021-03-31 1.255 0.692 -1.442
2020-12-31 0.802 0.493 -1.092
2020-09-30 0.668 0.377 -0.965
2020-06-30 0.744 0.419 -1.139
2020-03-31 1.155 0.580 -1.003

AMRS Price Target

For more insight on analysts targets of AMRS, see our AMRS price target page. And for a list of of all stocks sorted by upside potential based on analyst target price, see our Top Price Target page.

Average Price Target $22.83 Average Broker Recommendation 1.33 (Strong Buy)

Amyris, Inc. (AMRS) Company Bio


Amyris, Inc. provides various alternatives to a range of petroleum-sourced products for the consumer care, specialty chemical, and transportation fuel markets worldwide. The company was founded in 2003 and is based in Emeryville, California.


AMRS Latest News Stream


Event/Time News Detail
Loading, please wait...

AMRS Latest Social Stream


Loading social stream, please wait...

View Full AMRS Social Stream

Latest AMRS News From Around the Web

Below are the latest news stories about AMYRIS INC that investors may wish to consider to help them evaluate AMRS as an investment opportunity.

Today’s Biggest Pre-Market Stock Movers: 10 Top Gainers and Losers on Wednesday

Investors will want to get ready for another busy day of trading as we cover the biggest pre-market stock movers for Wednesday!

William White on InvestorPlace | August 16, 2023

Today’s Biggest Pre-Market Stock Movers: 10 Top Gainers and Losers on Monday

We're starting the week off right with a breakdown of the biggest pre-market stock movers worth knowing about on Monday morning!

William White on InvestorPlace | August 14, 2023

Today’s Biggest Pre-Market Stock Movers: 10 Top Gainers and Losers on Friday

It's time to start the final day of trading this week with a breakdown of the biggest pre-market stock movers for Friday!

William White on InvestorPlace | August 11, 2023

AMRS Stock Surges 152% as Amyris Files for Bankruptcy

Amyris (AMRS) stock is rising higher on Friday with heavy trading after the biotechnology company recently filed for bankruptcy.

William White on InvestorPlace | August 11, 2023

Retail investors flock to penny stocks WeWork, Amyris, Proterra

WeWork, a prized startup just four years ago but now a micro-cap, and other penny stocks such as Amyris and Proterra are the latest focus of speculative bets from retail traders, with shares of the financially struggling firms rising in strong trading volume after hitting record lows this week. The three penny stocks, up in the range of 40% to 120%, were the most actively traded U.S. shares at 10:45 a.m. ET on Friday. Amyris and WeWork were the second and third most traded stocks by retail investors, respectively, while Proterra was twelfth on the list at 10 a.m. ET, according to J.P.Morgan data.

Yahoo | August 11, 2023

Read More 'AMRS' Stories Here

AMRS Price Returns

1-mo N/A
3-mo -95.15%
6-mo -96.06%
1-year -98.29%
3-year -98.29%
5-year -99.33%
YTD -96.73%
2022 -71.72%
2021 -12.39%
2020 99.84%
2019 -7.49%
2018 -10.93%

Continue Researching AMRS

Want to see what other sources are saying about Amyris Inc's financials and stock price? Try the links below:

Amyris Inc (AMRS) Stock Price | Nasdaq
Amyris Inc (AMRS) Stock Quote, History and News - Yahoo Finance
Amyris Inc (AMRS) Stock Price and Basic Information | MarketWatch

Get Free Updates

Join thousands of investors who get the latest news, insights and top rated picks from StockNews.com!