American Superconductor Corporation (AMSC): Price and Financial Metrics

American Superconductor Corporation (AMSC): $13.51

0.06 (+0.45%)

POWR Rating

Component Grades

Momentum

F

Stability

D

Sentiment

Quality

C

Add AMSC to Watchlist
Sign Up

Industry: Industrial - Equipment

Industry

C

Ranked

#59 of 87

in industry

AMSC Price/Volume Stats

Current price $13.51 52-week high $17.37
Prev. close $13.45 52-week low $3.63
Day low $13.37 Volume 630,601
Day high $13.78 Avg. volume 1,077,777
50-day MA $12.81 Dividend yield N/A
200-day MA $9.47 Market Cap 415.24M

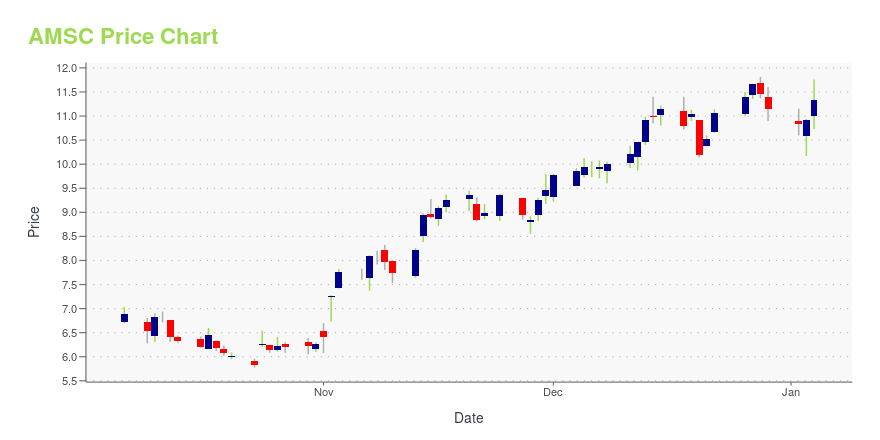
AMSC Stock Price Chart Interactive Chart >

AMSC POWR Grades

  • AMSC scores best on the Sentiment dimension, with a Sentiment rank ahead of 92.08% of US stocks.
  • The strongest trend for AMSC is in Quality, which has been heading up over the past 26 weeks.
  • AMSC's current lowest rank is in the Momentum metric (where it is better than 2.62% of US stocks).

AMSC Stock Summary

  • For AMSC, its debt to operating expenses ratio is greater than that reported by just 9.78% of US equities we're observing.
  • With a year-over-year growth in debt of -26.5%, AMERICAN SUPERCONDUCTOR CORP's debt growth rate surpasses merely 12.19% of about US stocks.
  • The volatility of AMERICAN SUPERCONDUCTOR CORP's share price is greater than that of 86.1% US stocks with at least 200 days of trading history.
  • Stocks that are quantitatively similar to AMSC, based on their financial statements, market capitalization, and price volatility, are QTRX, TALK, OSPN, SSTK, and AXGN.
  • AMSC's SEC filings can be seen here. And to visit AMERICAN SUPERCONDUCTOR CORP's official web site, go to www.amsc.com.

AMSC Valuation Summary

  • In comparison to the median Industrials stock, AMSC's price/earnings ratio is 161.5% lower, now standing at -13.9.
  • AMSC's price/sales ratio has moved down 9.8 over the prior 243 months.

Below are key valuation metrics over time for AMSC.

Stock Date P/S P/B P/E EV/EBIT
AMSC 2023-12-29 2.8 4.4 -13.9 -13.2
AMSC 2023-12-28 2.9 4.5 -14.3 -13.6
AMSC 2023-12-27 2.9 4.6 -14.5 -13.9
AMSC 2023-12-26 2.9 4.5 -14.2 -13.5
AMSC 2023-12-22 2.8 4.4 -13.8 -13.1
AMSC 2023-12-21 2.7 4.2 -13.1 -12.4

AMSC Growth Metrics

    Its year over year cash and equivalents growth rate is now at -34.49%.
  • Its 2 year net income to common stockholders growth rate is now at -12.27%.
  • Its 3 year net income to common stockholders growth rate is now at -171.72%.
AMSC's revenue has moved up $4,425,000 over the prior 15 months.

The table below shows AMSC's growth in key financial areas (numbers in millions of US dollars).

Date Revenue Operating Cash Flow Net Income to Common Stock
2022-12-31 102.549 -20.119 -33.204
2022-09-30 105.467 -18.815 -27.947
2022-06-30 105.695 -19.011 -22.5
2022-03-31 108.435 -18.977 -19.193
2021-12-31 101.291 -19.735 -21.777
2021-09-30 98.124 -13.862 -25.386

AMSC's Quality Factors

The “Quality” component of the POWR Ratings focuses on 31 different factors of a companies fundamentals and operational strength. Here are some key insights as we drill into the specifics of these quality attributes.
  • AMSC has a Quality Grade of C, ranking ahead of 30.14% of graded US stocks.
  • AMSC's asset turnover comes in at 0.564 -- ranking 28th of 53 Electrical Equipment stocks.
  • ITGR, EFOI, and THR are the stocks whose asset turnover ratios are most correlated with AMSC.

The table below shows AMSC's key quality metrics over time.

Period Asset Turnover Gross Margin ROIC
2021-06-30 0.564 0.173 -1.389
2021-03-31 0.617 0.200 -0.838
2020-12-31 0.647 0.203 -0.620
2020-09-30 0.669 0.187 -0.440
2020-06-30 0.601 0.181 -0.388
2020-03-31 0.526 0.148 -0.482

AMSC Price Target

For more insight on analysts targets of AMSC, see our AMSC price target page. And for a list of of all stocks sorted by upside potential based on analyst target price, see our Top Price Target page.

Average Price Target $27.33 Average Broker Recommendation 1.33 (Strong Buy)

American Superconductor Corporation (AMSC) Company Bio


American Superconductor Corporation provides megawatt-scale solutions worldwide. It operates through two segments, Wind and Grid. The company was founded in 1987 and is based in Devens, Massachusetts.


AMSC Latest News Stream


Event/Time News Detail
Loading, please wait...

AMSC Latest Social Stream


Loading social stream, please wait...

View Full AMSC Social Stream

Latest AMSC News From Around the Web

Below are the latest news stories about AMERICAN SUPERCONDUCTOR CORP that investors may wish to consider to help them evaluate AMSC as an investment opportunity.

Is American Superconductor (AMSC) Outperforming Other Computer and Technology Stocks This Year?

Here is how American Superconductor (AMSC) and CrowdStrike Holdings (CRWD) have performed compared to their sector so far this year.

Yahoo | December 28, 2023

3 Stocks to Watch for Major Upcoming Catalysts

Major, positive catalysts can cause stocks to soar.

Larry Ramer on InvestorPlace | December 14, 2023

Are Computer and Technology Stocks Lagging American Superconductor (AMSC) This Year?

Here is how American Superconductor (AMSC) and Arlo Technologies (ARLO) have performed compared to their sector so far this year.

Yahoo | December 11, 2023

Do You Believe in the Upside Potential of American Superconductor Corporation (AMSC)?

Meridian Funds, managed by ArrowMark Partners, released its “Meridian Contrarian Fund” third quarter 2023 investor letter. A copy of the same can be downloaded here. In the third quarter, the fund returned -6.16% (net) compared to a -4.78% return for the Russell 2500 Index. Furthermore, the fund underperformed its secondary benchmark, the Russell 2500 Value Index, […]

Yahoo | November 30, 2023

Wall Street Analysts Believe American Superconductor (AMSC) Could Rally 25.28%: Here's is How to Trade

The average of price targets set by Wall Street analysts indicates a potential upside of 25.3% in American Superconductor (AMSC). While the effectiveness of this highly sought-after metric is questionable, the positive trend in earnings estimate revisions might translate into an upside in the stock.

Yahoo | November 24, 2023

Read More 'AMSC' Stories Here

AMSC Price Returns

1-mo 2.12%
3-mo 21.27%
6-mo 78.94%
1-year 202.24%
3-year -21.27%
5-year 5.05%
YTD 21.27%
2023 202.72%
2022 -66.18%
2021 -53.54%
2020 198.34%
2019 -29.60%

Get Free Updates

Join thousands of investors who get the latest news, insights and top rated picks from StockNews.com!