American Superconductor Corporation (AMSC): Price and Financial Metrics

American Superconductor Corporation (AMSC): $7.50

0.00 (0.00%)

POWR Rating

Component Grades

Momentum

D

Stability

F

Sentiment

Quality

C

Add AMSC to Watchlist
Sign Up

Industry: Industrial - Equipment

Industry

B

Ranked

#67 of 92

in industry

AMSC Price/Volume Stats

Current price $7.50 52-week high $17.37
Prev. close $7.50 52-week low $3.20
Day low $7.38 Volume 807,698
Day high $7.70 Avg. volume 1,058,924
50-day MA $8.70 Dividend yield N/A
200-day MA $5.89 Market Cap 227.14M

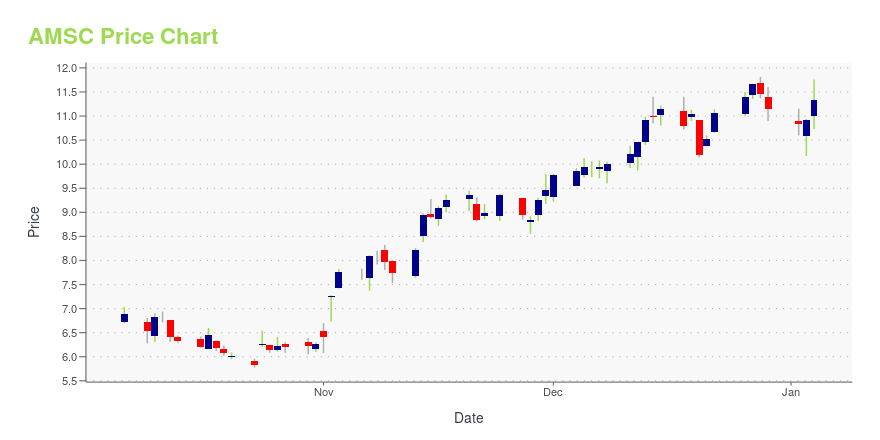
AMSC Stock Price Chart Interactive Chart >

AMSC POWR Grades

  • Growth is the dimension where AMSC ranks best; there it ranks ahead of 94.59% of US stocks.
  • The strongest trend for AMSC is in Growth, which has been heading up over the past 177 days.
  • AMSC's current lowest rank is in the Stability metric (where it is better than 4.83% of US stocks).

AMSC Stock Summary

  • For AMSC, its debt to operating expenses ratio is greater than that reported by just 10.28% of US equities we're observing.
  • With a year-over-year growth in debt of -27.55%, AMERICAN SUPERCONDUCTOR CORP's debt growth rate surpasses just 11.65% of about US stocks.
  • In terms of volatility of its share price, AMSC is more volatile than 87.8% of stocks we're observing.
  • Stocks that are quantitatively similar to AMSC, based on their financial statements, market capitalization, and price volatility, are FUBO, KRMD, OSS, PHUN, and SONX.
  • Visit AMSC's SEC page to see the company's official filings. To visit the company's web site, go to www.amsc.com.

AMSC Valuation Summary

  • AMSC's price/earnings ratio is -7.3; this is 139.25% lower than that of the median Industrials stock.
  • AMSC's EV/EBIT ratio has moved down 4.1 over the prior 243 months.

Below are key valuation metrics over time for AMSC.

Stock Date P/S P/B P/E EV/EBIT
AMSC 2023-09-19 2.0 3.0 -7.3 -6.7
AMSC 2023-09-18 2.1 3.0 -7.4 -6.8
AMSC 2023-09-15 2.1 3.0 -7.4 -6.8
AMSC 2023-09-14 2.0 3.0 -7.3 -6.7
AMSC 2023-09-13 2.0 2.9 -7.2 -6.6
AMSC 2023-09-12 2.1 3.0 -7.4 -6.8

AMSC Growth Metrics

    Its year over year cash and equivalents growth rate is now at -34.49%.
  • Its 2 year net income to common stockholders growth rate is now at -12.27%.
  • Its 3 year net income to common stockholders growth rate is now at -171.72%.
AMSC's revenue has moved up $4,425,000 over the prior 15 months.

The table below shows AMSC's growth in key financial areas (numbers in millions of US dollars).

Date Revenue Operating Cash Flow Net Income to Common Stock
2022-12-31 102.549 -20.119 -33.204
2022-09-30 105.467 -18.815 -27.947
2022-06-30 105.695 -19.011 -22.5
2022-03-31 108.435 -18.977 -19.193
2021-12-31 101.291 -19.735 -21.777
2021-09-30 98.124 -13.862 -25.386

AMSC's Quality Factors

The “Quality” component of the POWR Ratings focuses on 31 different factors of a companies fundamentals and operational strength. Here are some key insights as we drill into the specifics of these quality attributes.
  • AMSC has a Quality Grade of C, ranking ahead of 30.14% of graded US stocks.
  • AMSC's asset turnover comes in at 0.564 -- ranking 28th of 53 Electrical Equipment stocks.
  • ITGR, EFOI, and THR are the stocks whose asset turnover ratios are most correlated with AMSC.

The table below shows AMSC's key quality metrics over time.

Period Asset Turnover Gross Margin ROIC
2021-06-30 0.564 0.173 -1.389
2021-03-31 0.617 0.200 -0.838
2020-12-31 0.647 0.203 -0.620
2020-09-30 0.669 0.187 -0.440
2020-06-30 0.601 0.181 -0.388
2020-03-31 0.526 0.148 -0.482

AMSC Price Target

For more insight on analysts targets of AMSC, see our AMSC price target page. And for a list of of all stocks sorted by upside potential based on analyst target price, see our Top Price Target page.

Average Price Target $27.33 Average Broker Recommendation 1.33 (Strong Buy)

American Superconductor Corporation (AMSC) Company Bio


American Superconductor Corporation provides megawatt-scale solutions worldwide. It operates through two segments, Wind and Grid. The company was founded in 1987 and is based in Devens, Massachusetts.


AMSC Latest News Stream


Event/Time News Detail
Loading, please wait...

AMSC Latest Social Stream


Loading social stream, please wait...

View Full AMSC Social Stream

Latest AMSC News From Around the Web

Below are the latest news stories about AMERICAN SUPERCONDUCTOR CORP that investors may wish to consider to help them evaluate AMSC as an investment opportunity.

Is American Superconductor (NASDAQ:AMSC) In A Good Position To Deliver On Growth Plans?

We can readily understand why investors are attracted to unprofitable companies. For example, although Amazon.com made...

Yahoo | September 22, 2023

7 A-Rated Industrial Stocks to Buy for HUGE Returns

Industrial stocks also tend to do well when there’s plenty of infrastructure spending – and that’s something that will continue for the next several years.

Louis Navellier and the InvestorPlace Research Staff on InvestorPlace | September 18, 2023

The 7 Best Meme Stocks to Buy Now: September 2023

Let's take a look at seven past and present favorites of the Reddit set, each of which should be considered one of the best meme stocks to buy right now.

Thomas Niel on InvestorPlace | September 14, 2023

Future Winners: The 3 Best Stocks to Buy on Weakness Now

Investors can generate high profits by paying attention to these stocks to buy on weakness and waiting for the shares to recover.

Larry Ramer on InvestorPlace | September 11, 2023

Are Computer and Technology Stocks Lagging American Superconductor (AMSC) This Year?

Here is how American Superconductor (AMSC) and Adobe Systems (ADBE) have performed compared to their sector so far this year.

Yahoo | September 7, 2023

Read More 'AMSC' Stories Here

AMSC Price Returns

1-mo -21.30%
3-mo 19.81%
6-mo 52.75%
1-year 63.76%
3-year -49.90%
5-year 7.91%
YTD 103.80%
2022 -66.18%
2021 -53.54%
2020 198.34%
2019 -29.60%
2018 207.16%

Get Free Updates

Join thousands of investors who get the latest news, insights and top rated picks from StockNews.com!