AutoNation, Inc. (AN): Price and Financial Metrics
AN Price/Volume Stats
Current price | $139.57 | 52-week high | $158.30 |
Prev. close | $131.58 | 52-week low | $94.92 |
Day low | $132.11 | Volume | 826,000 |
Day high | $140.01 | Avg. volume | 713,620 |
50-day MA | $132.74 | Dividend yield | N/A |
200-day MA | $121.95 | Market Cap | 6.37B |
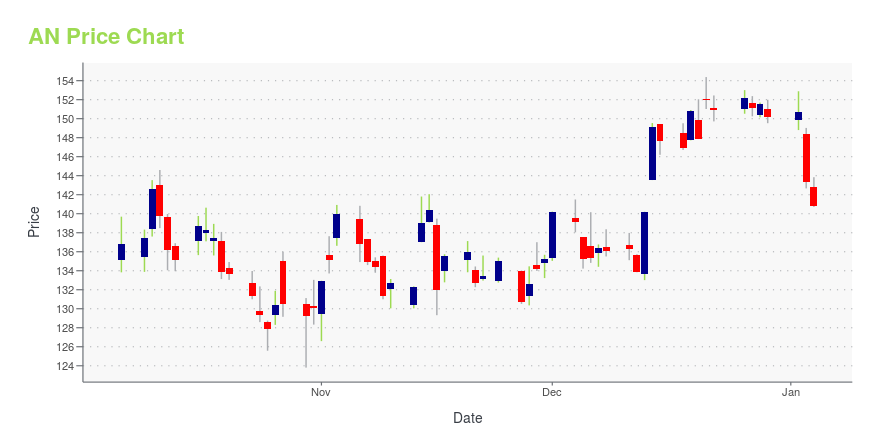
AN Stock Price Chart Interactive Chart >
AN POWR Grades
- Value is the dimension where AN ranks best; there it ranks ahead of 95.3% of US stocks.
- The strongest trend for AN is in Sentiment, which has been heading up over the past 179 days.
- AN ranks lowest in Growth; there it ranks in the 35th percentile.
AN Stock Summary
- The capital turnover (annual revenue relative to shareholder's equity) for AN is 13.18 -- better than 97.38% of US stocks.
- AN's price/sales ratio is 0.24; that's higher than the P/S ratio of just 7.8% of US stocks.
- AUTONATION INC's shareholder yield -- a measure of how much capital is returned to stockholders via dividends and buybacks -- is 20.86%, greater than the shareholder yield of 91.12% of stocks in our set.
- If you're looking for stocks that are quantitatively similar to AUTONATION INC, a group of peers worth examining would be PFGC, ARW, GPI, DXYN, and OMI.
- AN's SEC filings can be seen here. And to visit AUTONATION INC's official web site, go to www.autonation.com.
AN Valuation Summary
- AN's price/sales ratio is 0.2; this is 88.89% lower than that of the median Consumer Cyclical stock.
- Over the past 243 months, AN's price/earnings ratio has gone down 3.4.
Below are key valuation metrics over time for AN.
Stock | Date | P/S | P/B | P/E | EV/EBIT |
---|---|---|---|---|---|
AN | 2023-05-19 | 0.2 | 3.0 | 4.7 | 5.4 |
AN | 2023-05-18 | 0.2 | 3.1 | 4.8 | 5.5 |
AN | 2023-05-17 | 0.2 | 3.0 | 4.7 | 5.4 |
AN | 2023-05-16 | 0.2 | 3.0 | 4.6 | 5.3 |
AN | 2023-05-15 | 0.2 | 3.0 | 4.7 | 5.4 |
AN | 2023-05-12 | 0.2 | 3.0 | 4.6 | 5.4 |
AN Growth Metrics
- Its 2 year net income to common stockholders growth rate is now at 1089.9%.
- Its 3 year revenue growth rate is now at 26.3%.
- The 5 year cash and equivalents growth rate now stands at 630.02%.

The table below shows AN's growth in key financial areas (numbers in millions of US dollars).
Date | Revenue | Operating Cash Flow | Net Income to Common Stock |
---|---|---|---|
2022-12-31 | 26,985 | 1,668.1 | 1,377.4 |
2022-09-30 | 26,870.3 | 1,511.8 | 1,478.1 |
2022-06-30 | 26,583.8 | 1,592.4 | 1,487.2 |
2022-03-31 | 26,693 | 1,744.6 | 1,495.7 |
2021-12-31 | 25,844 | 1,627.7 | 1,373 |
2021-09-30 | 25,046.8 | 1,602.5 | 1,137.4 |
AN's Quality Factors
The “Quality” component of the POWR Ratings focuses on 31 different factors of a companies fundamentals and operational strength. Here are some key insights as we drill into the specifics of these quality attributes.- AN has a Quality Grade of B, ranking ahead of 91.24% of graded US stocks.
- AN's asset turnover comes in at 2.808 -- ranking 14th of 165 Retail stocks.
- SAH, TGT, and SHW are the stocks whose asset turnover ratios are most correlated with AN.
The table below shows AN's key quality metrics over time.
Period | Asset Turnover | Gross Margin | ROIC |
---|---|---|---|
2021-09-30 | 2.808 | 0.184 | 0.269 |
2021-06-30 | 2.595 | 0.179 | 0.238 |
2021-03-31 | 2.266 | 0.175 | 0.215 |
2020-12-31 | 2.067 | 0.175 | 0.116 |
2020-09-30 | 2.010 | 0.172 | 0.122 |
2020-06-30 | 1.972 | 0.168 | 0.110 |
AN Price Target
For more insight on analysts targets of AN, see our AN price target page. And for a list of of all stocks sorted by upside potential based on analyst target price, see our Top Price Target page.
Average Price Target | $131.57 | Average Broker Recommendation | 1.68 (Moderate Buy) |
AutoNation, Inc. (AN) Company Bio
AutoNation provides new and used automotive and spare parts retail services in the United States. The company operates in three segments: Domestic, Import, and Premium Luxury. The company is based in Fort Lauderdale, Florida.
Latest AN News From Around the Web
Below are the latest news stories about AUTONATION INC that investors may wish to consider to help them evaluate AN as an investment opportunity.
Used-car market in ‘uncharted territory’ as high prices remain sticky, Edmunds saysWith spring car buying season in full swing, those looking for a deal in the used car market are likely not going to find one. According to a new report titled “Used Market Enters Uncharted Territory Post-Pandemic” released from car-shopping site Edmunds.com, though used car prices softened a bit recently they still remain historically high. Edmunds’ data scoured from dealer retail pricing finds that the average used vehicle transaction price in Q1 slipped 6.4% year-over-year, but is still up 44% from five years ago. |
UPDATE 1-AutoNation names Thomas Szlosek as CFOAutoNation Inc named Thomas Szlosek as its chief financial officer, effective on or about Aug. 7, the auto retailer said on Tuesday. Szlosek will move from medical product maker Avantor Inc , where he is currently finance chief. AutoNation's current CFO Joe Lower will transition to a newly created role where he will oversee all business transformation initiatives. |
AutoNation Hires Thomas Szlosek as Executive Vice President and Chief Financial OfficerAutoNation, Inc. (NYSE: AN), America's most admired automotive retailer, announced Thomas Szlosek as its new Executive Vice President (EVP) and Chief Financial Officer (CFO), effective as of the commencement of his employment with the Company, which is expected to be on or about August 7, 2023. Mr. Szlosek will report to CEO Mike Manley and serve as a member of the senior leadership team, overseeing Accounting, Treasury, Tax, Audit, Business Analysis and Planning, Investor Relations, Finance Ope |
Will EVs Dent the Auto Repair Business?Electric vehicles could eventually make the business of oil change and air-filter replacements obsolete. |
What Does Bill Gates Know That You Don’t? 3 Stocks He Is Buying.The Bill Gates investing strategy is a simple one. |
AN Price Returns
1-mo | 4.77% |
3-mo | 0.42% |
6-mo | 16.31% |
1-year | 15.16% |
3-year | 233.98% |
5-year | 193.65% |
YTD | 30.07% |
2022 | -8.17% |
2021 | 67.43% |
2020 | 43.51% |
2019 | 36.22% |
2018 | -30.45% |
Continue Researching AN
Want to see what other sources are saying about Autonation Inc's financials and stock price? Try the links below:Autonation Inc (AN) Stock Price | Nasdaq
Autonation Inc (AN) Stock Quote, History and News - Yahoo Finance
Autonation Inc (AN) Stock Price and Basic Information | MarketWatch
Loading social stream, please wait...