
Abercrombie & Fitch Company (ANF): Price and Financial Metrics
ANF Price/Volume Stats
| Current price | $152.59 | 52-week high | $196.99 |
| Prev. close | $151.53 | 52-week low | $38.53 |
| Day low | $151.05 | Volume | 1,345,639 |
| Day high | $155.88 | Avg. volume | 1,670,543 |
| 50-day MA | $168.31 | Dividend yield | N/A |
| 200-day MA | $117.11 | Market Cap | 7.80B |
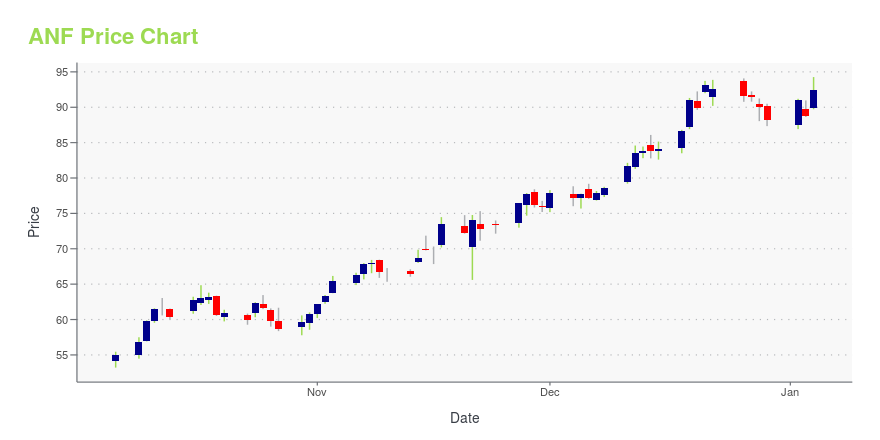
ANF Stock Price Chart Interactive Chart >
Abercrombie & Fitch Company (ANF) Company Bio
Abercrombie & Fitch is a global specialty retailer of high-quality, casual apparel for men, women and kids with an active, youthful lifestyle. The company was founded in 1892 and is based in New Albany, Ohio.
Latest ANF News From Around the Web
Below are the latest news stories about ABERCROMBIE & FITCH CO that investors may wish to consider to help them evaluate ANF as an investment opportunity.
Zumiez's (ZUMZ) Growth Strategies On Track: Time to Hold?Zumiez's (ZUMZ) business strategies appear encouraging. The company is gaining from its focus on providing differentiated assortments. |
Foot Locker's (FL) Growth Strategies Appear EncouragingFoot Locker (FL) is trying to improve its performance through operational and financial initiatives. Its cost-optimization program bodes well. |
Casey's (CASY) Growth Initiatives Position It Well for 2024Casey's (CASY) leverages technology, analytics and growth initiatives in product optimization and cost efficiency to enhance customer engagement, supporting robust growth and market presence. |
Stitch Fix (SFIX) is Poised on Operational Excellence & GrowthStitch Fix's (SFIX) focus on efficiency, client satisfaction and advanced technologies position it for success despite challenges in active client retention. |
Walmart (WMT) Looks Poised to Continue Its Growth Story in 2024Walmart (WMT) is poised to keep its growth story going with its robust store and online operations. Gains from higher-margin ventures, such as advertising, are also noteworthy. |
ANF Price Returns
| 1-mo | -12.01% |
| 3-mo | 24.99% |
| 6-mo | 47.00% |
| 1-year | 291.66% |
| 3-year | 294.60% |
| 5-year | 776.08% |
| YTD | 72.97% |
| 2023 | 285.07% |
| 2022 | -34.22% |
| 2021 | 71.07% |
| 2020 | 19.48% |
| 2019 | -9.74% |
Continue Researching ANF
Here are a few links from around the web to help you further your research on Abercrombie & Fitch Co's stock as an investment opportunity:Abercrombie & Fitch Co (ANF) Stock Price | Nasdaq
Abercrombie & Fitch Co (ANF) Stock Quote, History and News - Yahoo Finance
Abercrombie & Fitch Co (ANF) Stock Price and Basic Information | MarketWatch
Loading social stream, please wait...