AngioDynamics, Inc. (ANGO): Price and Financial Metrics

AngioDynamics, Inc. (ANGO): $9.44

0.15 (+1.61%)

POWR Rating

Component Grades

Growth

S

Value

I

Momentum

G

Stability

N

Sentiment

U

Quality

P

ANGO Price/Volume Stats

Current price $9.44 52-week high $24.74
Prev. close $9.29 52-week low $8.18
Day low $9.27 Volume 108,866
Day high $9.64 Avg. volume 331,918
50-day MA $9.66 Dividend yield N/A
200-day MA $14.02 Market Cap 370.39M

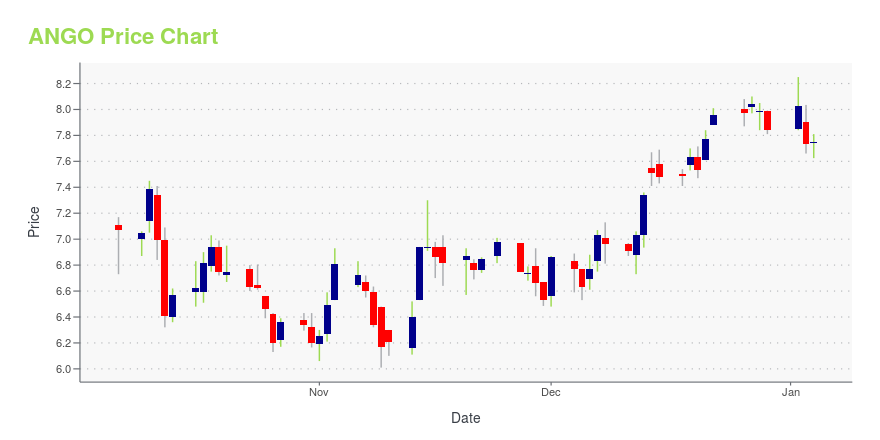
ANGO Stock Price Chart Interactive Chart >

ANGO POWR Grades

  • ANGO scores best on the Growth dimension, with a Growth rank ahead of 85.14% of US stocks.
  • The strongest trend for ANGO is in Value, which has been heading up over the past 179 days.
  • ANGO's current lowest rank is in the Momentum metric (where it is better than 15.05% of US stocks).

ANGO Stock Summary

  • ANGO's equity multiplier -- a measure of assets relative to shareholders'equity -- is greater than that of merely 19.87% of US stocks.
  • With a year-over-year growth in debt of 99.23%, ANGIODYNAMICS INC's debt growth rate surpasses 88.17% of about US stocks.
  • In terms of volatility of its share price, ANGO is more volatile than 82.93% of stocks we're observing.
  • Stocks with similar financial metrics, market capitalization, and price volatility to ANGIODYNAMICS INC are FNA, VISL, ITI, NLS, and SEMR.
  • Visit ANGO's SEC page to see the company's official filings. To visit the company's web site, go to www.angiodynamics.com.

ANGO Valuation Summary

  • ANGO's EV/EBIT ratio is -10.8; this is 190% lower than that of the median Healthcare stock.
  • ANGO's price/earnings ratio has moved down 81.5 over the prior 231 months.

Below are key valuation metrics over time for ANGO.

Stock Date P/S P/B P/E EV/EBIT
ANGO 2023-05-23 1.1 1.0 -10.3 -10.8
ANGO 2023-05-22 1.1 1.0 -10.2 -10.7
ANGO 2023-05-19 1.1 1.0 -10.1 -10.7
ANGO 2023-05-18 1.1 0.9 -10.1 -10.6
ANGO 2023-05-17 1.1 0.9 -10.1 -10.6
ANGO 2023-05-16 1.1 0.9 -9.9 -10.4

ANGO Growth Metrics

    The 3 year revenue growth rate now stands at -12.93%.
  • The 4 year net income to common stockholders growth rate now stands at 295.21%.
  • Its year over year cash and equivalents growth rate is now at -56.14%.
Over the past 70 months, ANGO's revenue has gone down $28,364,000.

The table below shows ANGO's growth in key financial areas (numbers in millions of US dollars).

Date Revenue Operating Cash Flow Net Income to Common Stock
2022-12-31 327.934 -17.477 -32.714
2022-09-30 320.785 -23.035 -32.579
2022-06-30 316.219 -7.194 -26.547
2022-03-31 306.063 -3.555 -39.749
2021-12-31 303.275 11.107 -38.335
2021-09-30 297.765 20.614 -34.252

ANGO's Quality Factors

The “Quality” component of the POWR Ratings focuses on 31 different factors of a companies fundamentals and operational strength. Here are some key insights as we drill into the specifics of these quality attributes.
  • ANGO has a Quality Grade of D, ranking ahead of 15.86% of graded US stocks.
  • ANGO's asset turnover comes in at 0.521 -- ranking 88th of 186 Medical Equipment stocks.
  • CLPT, EW, and IVC are the stocks whose asset turnover ratios are most correlated with ANGO.

The table below shows ANGO's key quality metrics over time.

Period Asset Turnover Gross Margin ROIC
2021-08-31 0.521 0.541 -0.324
2021-05-31 0.503 0.539 -0.282
2021-02-28 0.464 0.531 -1.297
2020-11-30 0.434 0.540 -1.344
2020-08-31 0.407 0.551 -1.516
2020-05-31 0.385 0.569 -1.758

ANGO Price Target

For more insight on analysts targets of ANGO, see our ANGO price target page. And for a list of of all stocks sorted by upside potential based on analyst target price, see our Top Price Target page.

Average Price Target $30.00 Average Broker Recommendation 1.5 (Moderate Buy)

AngioDynamics, Inc. (ANGO) Company Bio


AngioDynamics designs, manufactures, and sells various medical, surgical, and diagnostic devices for vascular access, surgery, peripheral vascular disease, and oncology in the United States and internationally. The company was founded in 1988 and is based in Latham, New York.


ANGO Latest News Stream


Event/Time News Detail
Loading, please wait...

ANGO Latest Social Stream


Loading social stream, please wait...

View Full ANGO Social Stream

Latest ANGO News From Around the Web

Below are the latest news stories about ANGIODYNAMICS INC that investors may wish to consider to help them evaluate ANGO as an investment opportunity.

New Strong Sell Stocks for May 18th

ANGO, FPAY and BRDG have been added to the Zacks Rank #5 (Strong Sell) List on May 18, 2023.

Yahoo | May 18, 2023

Zacks.com featured highlights include Dutch Bros, Chegg, Impinj and AngioDynamics

Dutch Bros, Chegg, Impinj and AngioDynamics are part of the Zacks Screen of the Week article.

Yahoo | May 16, 2023

Is the Options Market Predicting a Spike in AngioDynamics (ANGO) Stock?

Investors need to pay close attention to AngioDynamics (ANGO) stock based on the movements in the options market lately.

Yahoo | May 15, 2023

Sell These 4 Toxic Stocks to Prevent Portfolio Losses

The basic understanding of toxic stocks can help investors avoid huge losses and derive maximum benefit from their portfolios. Some toxic stocks that investors may consider dumping are BROS, CHGG, PI and ANGO.

Yahoo | May 15, 2023

Zacks.com featured highlights include AngioDynamics, Definitive Healthcare, Casella Waste Systems and Enviva

AngioDynamics, Definitive Healthcare, Casella Waste Systems and Enviva are part of the Zacks Screen of the Week article.

Yahoo | April 17, 2023

Read More 'ANGO' Stories Here

ANGO Price Returns

1-mo 13.46%
3-mo -24.60%
6-mo -25.84%
1-year N/A
3-year -7.54%
5-year -55.11%
YTD -31.45%
2022 -50.07%
2021 79.91%
2020 -4.25%
2019 -20.47%
2018 21.05%

Get Free Updates

Join thousands of investors who get the latest news, insights and top rated picks from StockNews.com!


Page generated in 0.658 seconds.