ANI Pharmaceuticals, Inc. (ANIP): Price and Financial Metrics


ANI Pharmaceuticals, Inc. (ANIP): $38.62

0.24 (+0.63%)

POWR Rating

Component Grades

Growth

S

Value

I

Momentum

G

Stability

N

Sentiment

U

Quality

P

Add ANIP to Watchlist
Sign Up

Industry: Biotech


Ranked

of

in industry

ANIP POWR Grades

  • Growth is the dimension where ANIP ranks best; there it ranks ahead of 96.42% of US stocks.
  • ANIP's strongest trending metric is Growth; it's been moving up over the last 177 days.
  • ANIP's current lowest rank is in the Momentum metric (where it is better than 7.21% of US stocks).

ANIP Stock Summary

  • With a one year PEG ratio of 61.61, ANI PHARMACEUTICALS INC is expected to have a higher PEG ratio (a measure of how expensive a stock is relative to its expected earnings growth) than 68.67% of US stocks.
  • Of note is the ratio of ANI PHARMACEUTICALS INC's sales and general administrative expense to its total operating expenses; 34.86% of US stocks have a lower such ratio.
  • Revenue growth over the past 12 months for ANI PHARMACEUTICALS INC comes in at 46.38%, a number that bests 83.26% of the US stocks we're tracking.
  • Stocks with similar financial metrics, market capitalization, and price volatility to ANI PHARMACEUTICALS INC are MRAI, TKNO, AGFS, XRX, and XMTR.
  • Visit ANIP's SEC page to see the company's official filings. To visit the company's web site, go to www.anipharmaceuticals.com.

ANIP Valuation Summary

  • ANIP's price/sales ratio is 2.1; this is 10.53% higher than that of the median Healthcare stock.
  • ANIP's price/sales ratio has moved down 3.5 over the prior 243 months.

Below are key valuation metrics over time for ANIP.

Stock Date P/S P/B P/E EV/EBIT
ANIP 2023-03-24 2.1 2.1 -13.3 -25.8
ANIP 2023-03-23 2.1 2.1 -13.4 -25.9
ANIP 2023-03-22 2.1 2.2 -13.7 -26.3
ANIP 2023-03-21 2.2 2.2 -14.1 -26.9
ANIP 2023-03-20 2.2 2.2 -13.9 -26.6
ANIP 2023-03-17 2.2 2.2 -13.9 -26.6

ANIP Growth Metrics

    The 4 year price growth rate now stands at -32%.
  • The 3 year cash and equivalents growth rate now stands at 89.43%.
  • Its 3 year net cashflow from operations growth rate is now at -162.1%.
Over the past 67 months, ANIP's revenue has gone up $138,387,000.

The table below shows ANIP's growth in key financial areas (numbers in millions of US dollars).

Date Revenue Operating Cash Flow Net Income to Common Stock
2022-09-30 283.082 -38.988 -69.197
2022-06-30 251.322 -48.013 -64.638
2022-03-31 226.092 -36.288 -63.414
2021-12-31 216.136 3.322 -42.793
2021-09-30 212.459 9.798 -22.102
2021-06-30 213.377 13.586 -17.221

ANIP's Quality Factors

The “Quality” component of the POWR Ratings focuses on 31 different factors of a companies fundamentals and operational strength. Here are some key insights as we drill into the specifics of these quality attributes.
  • ANIP has a Quality Grade of D, ranking ahead of 9.89% of graded US stocks.
  • ANIP's asset turnover comes in at 0.453 -- ranking 96th of 682 Pharmaceutical Products stocks.
  • NWBO, CYTR, and NAII are the stocks whose asset turnover ratios are most correlated with ANIP.

The table below shows ANIP's key quality metrics over time.

Period Asset Turnover Gross Margin ROIC
2021-09-30 0.453 0.570 -0.047
2021-06-30 0.457 0.592 -0.029
2021-03-31 0.460 0.600 -0.018
2020-12-31 0.446 0.582 -0.047
2020-09-30 0.427 0.596 -0.063
2020-06-30 0.425 0.619 -0.054

ANIP Price Target

For more insight on analysts targets of ANIP, see our ANIP price target page. And for a list of of all stocks sorted by upside potential based on analyst target price, see our Top Price Target page.

Average Price Target $45.00 Average Broker Recommendation 1.75 (Moderate Buy)

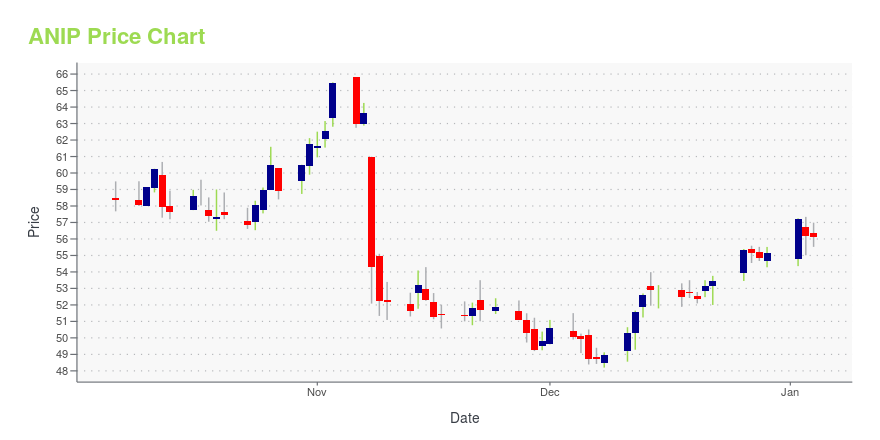
ANIP Stock Price Chart Interactive Chart >

Price chart for ANIP

ANIP Price/Volume Stats

Current price $38.62 52-week high $45.99
Prev. close $38.38 52-week low $22.31
Day low $37.27 Volume 73,982
Day high $39.98 Avg. volume 70,581
50-day MA $42.40 Dividend yield N/A
200-day MA $37.11 Market Cap 676.00M

ANI Pharmaceuticals, Inc. (ANIP) Company Bio


ANI Pharmaceuticals is an integrated specialty pharmaceutical company developing, manufacturing, and marketing branded and generic prescription pharmaceuticals. The company was founded in 2004 and is based in Baudette, Minnesota.


ANIP Latest News Stream


Event/Time News Detail
Loading, please wait...

ANIP Latest Social Stream


Loading social stream, please wait...

View Full ANIP Social Stream

Latest ANIP News From Around the Web

Below are the latest news stories about ANI PHARMACEUTICALS INC that investors may wish to consider to help them evaluate ANIP as an investment opportunity.

New Strong Sell Stocks for March 13th

ANIP, ARCB and ARCE have been added to the Zacks Rank #5 (Strong Sell) List on March 13, 2023.

Yahoo | March 13, 2023

Q4 2022 ANI Pharmaceuticals Inc Earnings Call

Q4 2022 ANI Pharmaceuticals Inc Earnings Call

Yahoo | March 10, 2023

ANI Pharmaceuticals (ANIP) Q4 Earnings and Revenues Top Estimates

ANI (ANIP) delivered earnings and revenue surprises of 11.76% and 8.62%, respectively, for the quarter ended December 2022. Do the numbers hold clues to what lies ahead for the stock?

Yahoo | March 9, 2023

ANI Pharmaceuticals Reports Record Fourth Quarter Financial Results and Achieves Full Year 2022 Revenue Milestone; Initiates 2023 Guidance

BAUDETTE, Minn., March 09, 2023--ANI Pharmaceuticals, Inc. (Nasdaq: ANIP) (ANI or the Company) today announced business highlights and financial results for the three and 12 months ended December 31, 2022.

Yahoo | March 9, 2023

ANI Pharmaceuticals (ANIP) Earnings Expected to Grow: Should You Buy?

ANI (ANIP) doesn't possess the right combination of the two key ingredients for a likely earnings beat in its upcoming report. Get prepared with the key expectations.

Yahoo | March 2, 2023

Read More 'ANIP' Stories Here

ANIP Price Returns

1-mo -6.10%
3-mo -1.43%
6-mo 22.10%
1-year 37.10%
3-year 2.28%
5-year -33.67%
YTD -4.00%
2022 -12.70%
2021 58.68%
2020 -52.91%
2019 36.98%
2018 -30.15%

Get Free Updates

Join thousands of investors who get the latest news, insights and top rated picks from StockNews.com!


Page generated in 0.6907 seconds.