
Sphere 3D Corp. (ANY): Price and Financial Metrics
ANY Price/Volume Stats
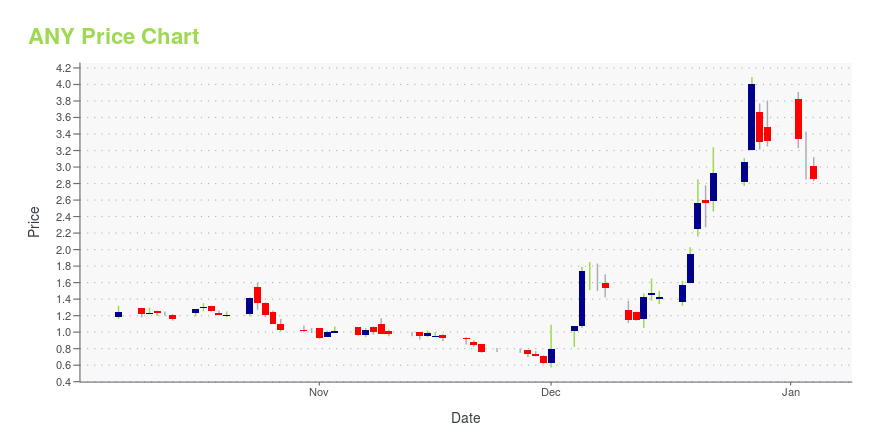
| Current price | $1.07 | 52-week high | $4.09 |
| Prev. close | $1.03 | 52-week low | $0.57 |
| Day low | $1.05 | Volume | 366,952 |
| Day high | $1.12 | Avg. volume | 860,194 |
| 50-day MA | $1.13 | Dividend yield | N/A |
| 200-day MA | $1.47 | Market Cap | 19.59M |
ANY Stock Price Chart Interactive Chart >
Latest ANY News From Around the Web
Below are the latest news stories about SPHERE 3D CORP that investors may wish to consider to help them evaluate ANY as an investment opportunity.
Sphere 3D Corp. (NASDAQ:ANY) Soars 53% But It's A Story Of Risk Vs RewardSphere 3D Corp. ( NASDAQ:ANY ) shares have had a really impressive month, gaining 53% after a shaky period beforehand... |
Sphere 3D Corp. Provides November 2023 Production and Operation UpdatesToronto, Ontario--(Newsfile Corp. - December 5, 2023) - Sphere 3D Corp. (NASDAQ: ANY) ("Sphere 3D" or the "Company"), dedicated to becoming the leading carbon-neutral Bitcoin mining company is providing results of its Bitcoin mining operation for Nov 2023.Key Highlights:71.7 Bitcoin mined in November, up 4% from October and up 596% YoY.Month-end operating hash rate was 1.3 EH/s, flat from October and up 13X YoY.Uptime was 86%.Metrics1Nov 2022Oct 2023Nov 2023Bitcoin Mined10.3 69.271.7 ... |
Today’s Biggest Pre-Market Stock Movers: 10 Top Gainers and Losers on MondayIt's time to start of the trading week with a look at the biggest pre-market stock movers worth watching on Monday morning! |
Sphere 3D Third Quarter 2023 Earnings: US$0.50 loss per share (vs US$2.14 loss in 3Q 2022)Sphere 3D ( NASDAQ:ANY ) Third Quarter 2023 Results Key Financial Results Revenue: US$5.72m (up 322% from 3Q 2022). Net... |
Sphere 3D Reports Third Quarter 2023 Financial Results and Operational UpdatesToronto, Ontario--(Newsfile Corp. - November 13, 2023) - Sphere 3D Corp. (NASDAQ: ANY) ("Sphere 3D" or the "Company"), dedicated to becoming the leading carbon-neutral Bitcoin mining company operating at an industrial scale, today reported financial results for the third quarter ended September 30, 2023.Q3 2023 HighlightsRevenue increased 322% year-over-year to $5.7 million.Mined 181.7 Bitcoin, representing a 396% increase year-over-year. As of September 30, 2023, the Company had Bitcoin holding |
ANY Price Returns
| 1-mo | -1.83% |
| 3-mo | -0.93% |
| 6-mo | -52.65% |
| 1-year | -55.04% |
| 3-year | -94.62% |
| 5-year | -89.97% |
| YTD | -67.77% |
| 2023 | 72.15% |
| 2022 | -91.17% |
| 2021 | 118.18% |
| 2020 | 83.76% |
| 2019 | -74.49% |
Continue Researching ANY
Want to do more research on Sphere 3D Corp's stock and its price? Try the links below:Sphere 3D Corp (ANY) Stock Price | Nasdaq
Sphere 3D Corp (ANY) Stock Quote, History and News - Yahoo Finance
Sphere 3D Corp (ANY) Stock Price and Basic Information | MarketWatch
Loading social stream, please wait...