
Alpha and Omega Semiconductor Limited (AOSL): Price and Financial Metrics
AOSL Price/Volume Stats
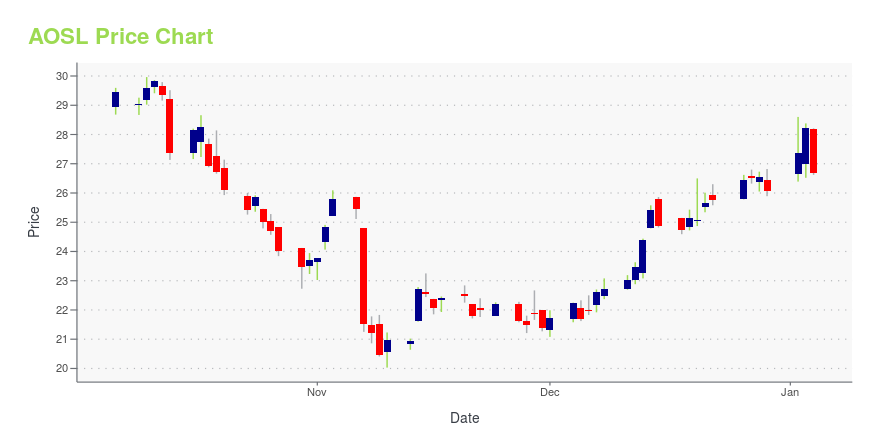
| Current price | $43.53 | 52-week high | $47.45 |
| Prev. close | $41.10 | 52-week low | $19.38 |
| Day low | $41.84 | Volume | 355,697 |
| Day high | $44.40 | Avg. volume | 227,604 |
| 50-day MA | $34.63 | Dividend yield | N/A |
| 200-day MA | $26.55 | Market Cap | 1.25B |
AOSL Stock Price Chart Interactive Chart >
Alpha and Omega Semiconductor Limited (AOSL) Company Bio
Alpha and Omega Semiconductor Limited, together with its subsidiaries, designs, develops, and supplies a portfolio of power semiconductors for consumer, computing, communications, and industrial markets primarily in the United States, Hong Kong, Macau, China, Taiwan, South Korea, and Japan. The company was founded in 2000 and is based in Sunnyvale, California.
Latest AOSL News From Around the Web
Below are the latest news stories about ALPHA & OMEGA SEMICONDUCTOR LTD that investors may wish to consider to help them evaluate AOSL as an investment opportunity.
Alpha and Omega Semiconductor Limited (NASDAQ:AOSL) is largely controlled by institutional shareholders who own 64% of the companyKey Insights Significantly high institutional ownership implies Alpha and Omega Semiconductor's stock price is... |
Alpha and Omega Semiconductor Announces Automotive Grade 80V and 100V MOSFETs in TO-Leadless Packaging Technology for e-MobilitySUNNYVALE, Calif., December 13, 2023--Alpha and Omega Semiconductor Limited (AOS) (Nasdaq: AOSL), a designer, developer, and global supplier of a broad range of discrete power devices, wide band gap power devices, power management ICs, and modules, today announced the release of its state-of-the-art automotive TO-Leadless (TOLL) package for the company’s automotive grade 80V and 100V MOSFETs. AOS’s TOLL package is developed to optimize the company’s power semiconductors as essential components i |
Those who invested in Alpha and Omega Semiconductor (NASDAQ:AOSL) five years ago are up 100%Alpha and Omega Semiconductor Limited ( NASDAQ:AOSL ) shareholders might be concerned after seeing the share price drop... |
Alpha and Omega Semiconductor to Participate in 12th Annual CEO Investor Summit 2023SUNNYVALE, Calif., November 16, 2023--Alpha and Omega Semiconductor to Participate in 12th Annual CEO Investor Summit 2023 |
Chipmaker GlobalFoundries Beats Earnings Goal On In-Line SalesContract chipmaker GlobalFoundries beat expectations for earnings in the third quarter while matching views on sales. |
AOSL Price Returns
| 1-mo | 16.45% |
| 3-mo | 96.17% |
| 6-mo | 62.43% |
| 1-year | 40.97% |
| 3-year | 78.40% |
| 5-year | 309.12% |
| YTD | 67.04% |
| 2023 | -8.79% |
| 2022 | -52.82% |
| 2021 | 156.18% |
| 2020 | 73.57% |
| 2019 | 33.66% |
Continue Researching AOSL
Want to do more research on ALPHA & OMEGA SEMICONDUCTOR Ltd's stock and its price? Try the links below:ALPHA & OMEGA SEMICONDUCTOR Ltd (AOSL) Stock Price | Nasdaq
ALPHA & OMEGA SEMICONDUCTOR Ltd (AOSL) Stock Quote, History and News - Yahoo Finance
ALPHA & OMEGA SEMICONDUCTOR Ltd (AOSL) Stock Price and Basic Information | MarketWatch
Loading social stream, please wait...