
StoneBridge Acquisition Corp. (APACU): Price and Financial Metrics
APACU Price/Volume Stats
| Current price | $12.10 | 52-week high | $12.63 |
| Prev. close | $8.19 | 52-week low | $5.65 |
| Day low | $8.70 | Volume | 5,500 |
| Day high | $12.20 | Avg. volume | 2,338 |
| 50-day MA | $0.00 | Dividend yield | N/A |
| 200-day MA | $0.00 | Market Cap | N/A |
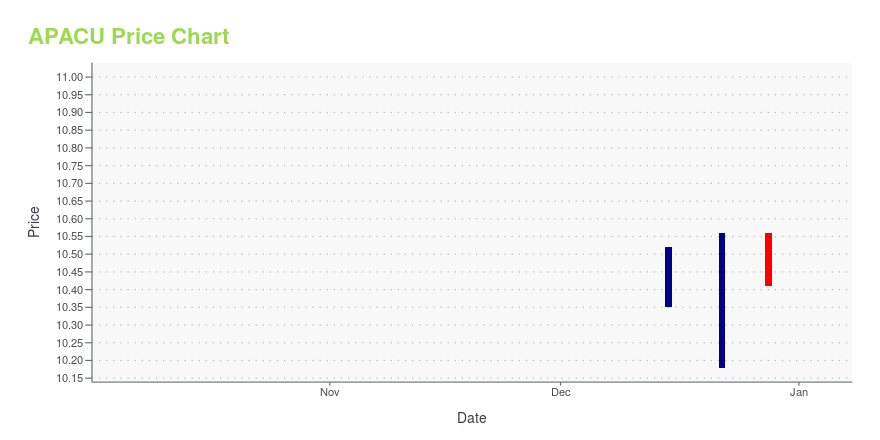
APACU Stock Price Chart Interactive Chart >
APACU Price Returns
| 1-mo | N/A |
| 3-mo | N/A |
| 6-mo | N/A |
| 1-year | N/A |
| 3-year | 21.24% |
| 5-year | N/A |
| YTD | N/A |
| 2023 | N/A |
| 2022 | 0.00% |
| 2021 | N/A |
| 2020 | N/A |
| 2019 | N/A |
Loading social stream, please wait...