Amphenol Corp. CI A (APH): Price and Financial Metrics
APH Price/Volume Stats
Current price | $93.23 | 52-week high | $93.44 |
Prev. close | $92.48 | 52-week low | $72.00 |
Day low | $92.29 | Volume | 5,882,100 |
Day high | $93.44 | Avg. volume | 2,578,116 |
50-day MA | $85.51 | Dividend yield | 0.92% |
200-day MA | $82.29 | Market Cap | 55.78B |
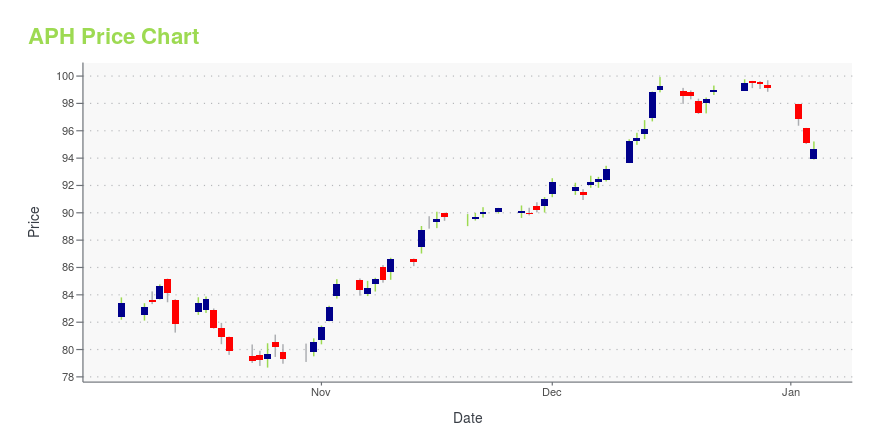
APH Stock Price Chart Interactive Chart >
APH POWR Grades
- APH scores best on the Sentiment dimension, with a Sentiment rank ahead of 89.75% of US stocks.
- The strongest trend for APH is in Growth, which has been heading down over the past 177 days.
- APH ranks lowest in Value; there it ranks in the 10th percentile.
APH Stock Summary
- AMPHENOL CORP's market capitalization of $55,212,068,117 is ahead of 95.6% of US-listed equities.
- APH's one year PEG ratio, measuring expected growth in earnings next year relative to current common stock price is 2,280.51 -- higher than 98.39% of US-listed equities with positive expected earnings growth.
- In terms of volatility of its share price, APH is more volatile than only 10.94% of stocks we're observing.
- Stocks that are quantitatively similar to APH, based on their financial statements, market capitalization, and price volatility, are ROST, LULU, ADM, FND, and FUL.
- Visit APH's SEC page to see the company's official filings. To visit the company's web site, go to www.amphenol.com.
APH Valuation Summary
- In comparison to the median Technology stock, APH's price/earnings ratio is 8.53% higher, now standing at 28.
- Over the past 243 months, APH's price/sales ratio has gone up 2.
Below are key valuation metrics over time for APH.
Stock | Date | P/S | P/B | P/E | EV/EBIT |
---|---|---|---|---|---|
APH | 2023-11-28 | 4.3 | 6.8 | 28.0 | 22.1 |
APH | 2023-11-27 | 4.3 | 6.9 | 28.1 | 22.2 |
APH | 2023-11-24 | 4.3 | 6.9 | 28.1 | 22.2 |
APH | 2023-11-22 | 4.3 | 6.9 | 28.1 | 22.2 |
APH | 2023-11-21 | 4.3 | 6.8 | 27.9 | 22.1 |
APH | 2023-11-20 | 4.3 | 6.8 | 27.9 | 22.0 |
APH Growth Metrics
- Its 3 year net cashflow from operations growth rate is now at 18.38%.
- Its year over year price growth rate is now at 6.18%.
- Its 5 year cash and equivalents growth rate is now at 86.26%.

The table below shows APH's growth in key financial areas (numbers in millions of US dollars).
Date | Revenue | Operating Cash Flow | Net Income to Common Stock |
---|---|---|---|
2022-12-31 | 12,623 | 2,174.6 | 1,902.3 |
2022-09-30 | 12,410.7 | 1,939.9 | 1,859.8 |
2022-06-30 | 11,934 | 1,724.7 | 1,789.7 |
2022-03-31 | 11,451.1 | 1,569.9 | 1,687 |
2021-12-31 | 10,876.3 | 1,540.1 | 1,590.8 |
2021-09-30 | 10,275.5 | 1,510.5 | 1,482.9 |
APH's Quality Factors
The “Quality” component of the POWR Ratings focuses on 31 different factors of a companies fundamentals and operational strength. Here are some key insights as we drill into the specifics of these quality attributes.- APH has a Quality Grade of C, ranking ahead of 52.04% of graded US stocks.
- APH's asset turnover comes in at 0.748 -- ranking 95th of 208 Electronic Equipment stocks.
- LHX, HEAR, and MICT are the stocks whose asset turnover ratios are most correlated with APH.
The table below shows APH's key quality metrics over time.
Period | Asset Turnover | Gross Margin | ROIC |
---|---|---|---|
2021-09-30 | 0.748 | 0.314 | 0.245 |
2021-06-30 | 0.756 | 0.314 | 0.256 |
2021-03-31 | 0.753 | 0.311 | 0.261 |
2020-12-31 | 0.726 | 0.310 | 0.240 |
2020-09-30 | 0.726 | 0.310 | 0.237 |
2020-06-30 | 0.724 | 0.309 | 0.231 |
APH Price Target
For more insight on analysts targets of APH, see our APH price target page. And for a list of of all stocks sorted by upside potential based on analyst target price, see our Top Price Target page.
Average Price Target | $78.77 | Average Broker Recommendation | 1.56 (Moderate Buy) |
Amphenol Corp. CI A (APH) Company Bio
Amphenol Corporation is a major producer of electronic and fiber optic connectors, cable and interconnect systems such as coaxial cables. Amphenol is a portmanteau from the corporation's original name, American Phenolic Corp. (Source:Wikipedia)
Latest APH News From Around the Web
Below are the latest news stories about AMPHENOL CORP that investors may wish to consider to help them evaluate APH as an investment opportunity.
Insiders Are Buying These 3 Tech StocksInsiders have a more extended holding period than most, a critical aspect that investors should be aware of. |
Amphenol Corporation's (NYSE:APH) Stock's On An Uptrend: Are Strong Financials Guiding The Market?Most readers would already be aware that Amphenol's (NYSE:APH) stock increased significantly by 13% over the past... |
Why Is Amphenol (APH) Up 12.3% Since Last Earnings Report?Amphenol (APH) reported earnings 30 days ago. What's next for the stock? We take a look at earnings estimates for some clues. |
Amphenol (NYSE:APH) Is Increasing Its Dividend To $0.22Amphenol Corporation ( NYSE:APH ) will increase its dividend from last year's comparable payment on the 10th of January... |
Robert Livingston Bought 25% More Shares In AmphenolAmphenol Corporation ( NYSE:APH ) shareholders (or potential shareholders) will be happy to see that the Independent... |
APH Price Returns
1-mo | 9.60% |
3-mo | 8.81% |
6-mo | 17.70% |
1-year | 20.00% |
3-year | 43.80% |
5-year | 130.15% |
YTD | 23.40% |
2022 | -11.96% |
2021 | 34.94% |
2020 | 22.09% |
2019 | 34.91% |
2018 | -6.82% |
APH Dividends
Ex-Dividend Date | Type | Payout Amount | Change | ||||||
---|---|---|---|---|---|---|---|---|---|
Loading, please wait... |
Continue Researching APH
Want to do more research on Amphenol Corp's stock and its price? Try the links below:Amphenol Corp (APH) Stock Price | Nasdaq
Amphenol Corp (APH) Stock Quote, History and News - Yahoo Finance
Amphenol Corp (APH) Stock Price and Basic Information | MarketWatch
Loading social stream, please wait...