
Agora Inc. ADR (API): Price and Financial Metrics
API Price/Volume Stats
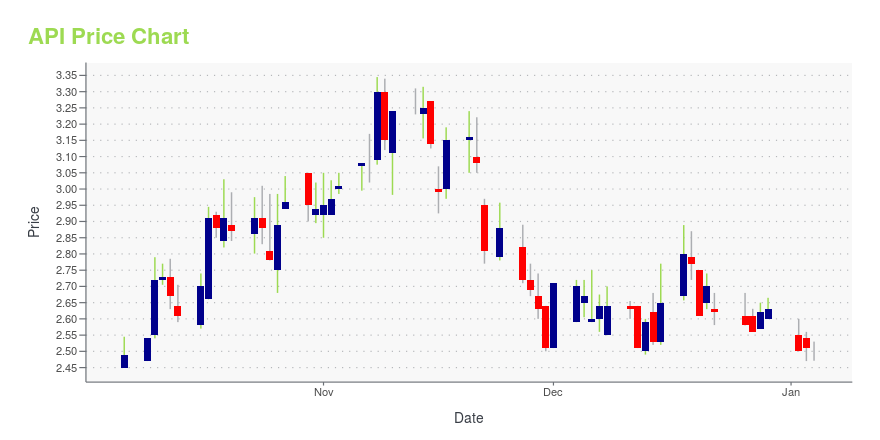
| Current price | $2.49 | 52-week high | $3.35 |
| Prev. close | $2.48 | 52-week low | $2.03 |
| Day low | $2.48 | Volume | 82,600 |
| Day high | $2.56 | Avg. volume | 197,198 |
| 50-day MA | $2.47 | Dividend yield | N/A |
| 200-day MA | $2.65 | Market Cap | 229.58M |
API Stock Price Chart Interactive Chart >
Agora Inc. ADR (API) Company Bio
Agora, Inc. provides Real-Time Engagement Platform-as-a-Service (RTE-PaaS) in the People's Republic of China, the United States, and internationally. Its RTE-PaaS offers developers with software tools to embed real-time video, voice, and messaging functionalities into applications. The company's enterprise-grade products include Real-Time Video, Real-Time Voice, Live Interactive Video and Audio Streaming, Real-Time Messaging, Real-Time Recording, Real-Time Streaming Acceleration, and various use case products that serves as building blocks for developers to embed the respective functions in applications. Its real-time engagement products are delivered through its Software-Defined Real-Time Network, which is a virtual network overlay on top of the public internet. The company offers its solutions in the areas of social, education, entertainment, gaming, enterprise, financial Services, healthcare, and Internet of Things, as well as provides customer support services. Agora, Inc. was founded in 2013 and is headquartered in Shanghai, China.
Latest API News From Around the Web
Below are the latest news stories about AGORA INC that investors may wish to consider to help them evaluate API as an investment opportunity.
Agora, Inc. Announces Executive Leadership UpdateSANTA CLARA, Calif., Dec. 07, 2023 (GLOBE NEWSWIRE) -- Agora, Inc. (NASDAQ: API) (the “Company”), a pioneer and leader in real-time engagement technology, today announced a change in its executive leadership. Stanley Wei will step down from his roles as the Company’s Chief Strategy Officer and Chief Operating Officer, Agora. Mr. Wei will transition his operational responsibilities to Tony Zhao, founder, chairman and CEO of the Company, and Tony Wang, Chief Revenue Officer, Agora, effective Decem |
Implied Volatility Surging for Agora (API) Stock OptionsInvestors need to pay close attention to Agora (API) stock based on the movements in the options market lately. |
Agora, Inc. (NASDAQ:API) Q3 2023 Earnings Call TranscriptAgora, Inc. (NASDAQ:API) Q3 2023 Earnings Call Transcript November 22, 2023 Operator: Good day, and thank you for standing by. Welcome to Agora, Inc. Third Quarter 2023 Financial Results Conference Call. [Operator Instructions] Please be advised that today’s conference is being recorded. The company’s earnings results press release, earnings presentations, SEC filings and a replay […] |
Q3 2023 Agora Inc Earnings CallQ3 2023 Agora Inc Earnings Call |
Agora, Inc. Reports Third Quarter 2023 Financial ResultsSANTA CLARA, Calif., Nov. 21, 2023 (GLOBE NEWSWIRE) -- Agora, Inc. (NASDAQ: API) (the “Company”), a pioneer and leader in real-time engagement technology, today announced its unaudited financial results for the third quarter ended September 30, 2023. “We delivered sequential revenue growth amid a very challenging operating environment in this quarter, by staying laser-focused on key customers and core product improvements. Our continued cost discipline has enabled us to further reduce our adjust |
API Price Returns
| 1-mo | 12.16% |
| 3-mo | -1.19% |
| 6-mo | -8.79% |
| 1-year | -17.28% |
| 3-year | -90.87% |
| 5-year | N/A |
| YTD | -5.32% |
| 2023 | -32.74% |
| 2022 | -75.88% |
| 2021 | -59.02% |
| 2020 | N/A |
| 2019 | N/A |
Loading social stream, please wait...