Applied Therapeutics, Inc. (APLT): Price and Financial Metrics
APLT Price/Volume Stats
| Current price | $0.49 | 52-week high | $10.62 |
| Prev. close | $0.49 | 52-week low | $0.30 |
| Day low | $0.46 | Volume | 591,446 |
| Day high | $0.50 | Avg. volume | 3,083,325 |
| 50-day MA | $0.44 | Dividend yield | N/A |
| 200-day MA | $3.62 | Market Cap | 68.96M |
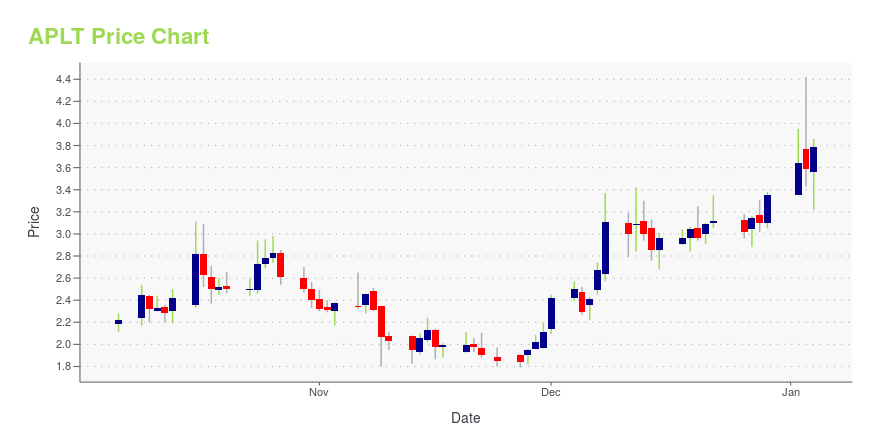
APLT Stock Price Chart Interactive Chart >
Applied Therapeutics, Inc. (APLT) Company Bio
Applied Therapeutics, Inc. is a clinical-stage biopharmaceutical company, which engages in developing a pipeline of novel product candidates against validated molecular targets in indications of high unmet medical need. The company was founded by Shoshana Shendelman on January 20, 2016 and is headquartered in New York, NY
APLT Price Returns
| 1-mo | 49.30% |
| 3-mo | -24.27% |
| 6-mo | -94.36% |
| 1-year | -88.86% |
| 3-year | -70.48% |
| 5-year | -98.89% |
| YTD | -42.77% |
| 2024 | -74.44% |
| 2023 | 340.79% |
| 2022 | -91.51% |
| 2021 | -59.34% |
| 2020 | -19.32% |


Loading social stream, please wait...