Apogee Enterprises, Inc. (APOG): Price and Financial Metrics
GET POWR RATINGS... FREE!
APOG POWR Grades
- Quality is the dimension where APOG ranks best; there it ranks ahead of 79.4% of US stocks.
- The strongest trend for APOG is in Growth, which has been heading up over the past 179 days.
- APOG's current lowest rank is in the Stability metric (where it is better than 62.23% of US stocks).
APOG Stock Summary
- Apogee Enterprises Inc's capital turnover -- a measure of revenue relative to shareholder's equity -- is better than 81.79% of US listed stocks.
- Apogee Enterprises Inc's stock had its IPO on January 1, 1986, making it an older stock than 92.84% of US equities in our set.
- In terms of twelve month growth in earnings before interest and taxes, Apogee Enterprises Inc is reporting a growth rate of -126.53%; that's higher than merely 14.91% of US stocks.
- If you're looking for stocks that are quantitatively similar to Apogee Enterprises Inc, a group of peers worth examining would be OCFC, FBMS, HTBK, BHB, and BFC.
- APOG's SEC filings can be seen here. And to visit Apogee Enterprises Inc's official web site, go to www.apog.com.
APOG Valuation Summary
- In comparison to the median Basic Materials stock, APOG's EV/EBIT ratio is 128.95% higher, now standing at 34.8.
- Over the past 243 months, APOG's price/sales ratio has gone up 0.6.
- APOG's price/sales ratio has moved up 0.6 over the prior 243 months.
Below are key valuation metrics over time for APOG.
Stock | Date | P/S | P/B | P/E | EV/EBIT |
---|---|---|---|---|---|
APOG | 2021-09-03 | 0.9 | 2.2 | 47.5 | 34.8 |
APOG | 2021-09-02 | 0.9 | 2.2 | 47.6 | 34.8 |
APOG | 2021-09-01 | 0.9 | 2.2 | 47.2 | 34.6 |
APOG | 2021-08-31 | 0.9 | 2.2 | 46.9 | 34.4 |
APOG | 2021-08-30 | 0.9 | 2.2 | 47.1 | 34.5 |
APOG | 2021-08-27 | 0.9 | 2.2 | 47.7 | 34.9 |
APOG Growth Metrics
- Its 5 year revenue growth rate is now at 41.4%.
- Its 4 year revenue growth rate is now at 41.4%.
- Its year over year net cashflow from operations growth rate is now at 32.26%.

The table below shows APOG's growth in key financial areas (numbers in millions of US dollars).
Date | Revenue | Operating Cash Flow | Net Income to Common Stock |
---|---|---|---|
2021-12-31 | 1,294.632 | 107.642 | -22.613 |
2021-09-30 | 1,273.998 | 111.44 | 3.603 |
2021-06-30 | 1,267.684 | 124.77 | 23.377 |
2021-03-31 | 1,230.774 | 141.863 | 15.436 |
2020-12-31 | 1,259.26 | 174.173 | 69.765 |
2020-09-30 | 1,283.593 | 174.79 | 47.726 |
APOG's Quality Factors
The “Quality” component of the POWR Ratings focuses on 31 different factors of a companies fundamentals and operational strength. Here are some key insights as we drill into the specifics of these quality attributes.- APOG has a Quality Grade of B, ranking ahead of 77.84% of graded US stocks.
- APOG's asset turnover comes in at 1.253 -- ranking 12th of 50 Consumer Goods stocks.
- LEG, HOFT, and SNBR are the stocks whose asset turnover ratios are most correlated with APOG.
The table below shows APOG's key quality metrics over time.
Period | Asset Turnover | Gross Margin | ROIC |
---|---|---|---|
2021-08-28 | 1.253 | 0.200 | 0.014 |
2021-05-29 | 1.223 | 0.223 | 0.055 |
2021-02-27 | 1.165 | 0.224 | 0.041 |
2020-11-28 | 1.160 | 0.225 | 0.144 |
2020-08-29 | 1.166 | 0.225 | 0.101 |
2020-05-30 | 1.177 | 0.226 | 0.100 |
APOG Price Target
For more insight on analysts targets of APOG, see our APOG price target page. And for a list of of all stocks sorted by upside potential based on analyst target price, see our Top Price Target page.
Average Price Target | $41.50 | Average Broker Recommendation | 1.8 (Moderate Buy) |
APOG Stock Price Chart Interactive Chart >
APOG Price/Volume Stats
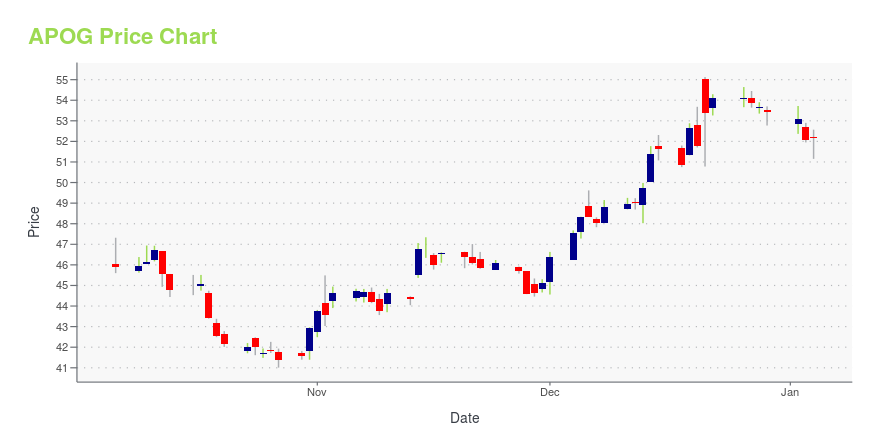
Current price | $41.63 | 52-week high | $50.44 |
Prev. close | $42.03 | 52-week low | $33.88 |
Day low | $41.34 | Volume | 229,200 |
Day high | $43.44 | Avg. volume | 186,664 |
50-day MA | $45.77 | Dividend yield | 2.09% |
200-day MA | $44.15 | Market Cap | 924.02M |
Apogee Enterprises, Inc. (APOG) Company Bio
Apogee Enterprises designs and develops glass solutions for enclosing commercial buildings and framing art in the United States, Canada, and Brazil. It operates through four segments: Architectural Glass, Architectural Services, Architectural Framing Systems, and Large-Scale Optical Technologies (LSO). The company was founded in 1949 and is based in Minneapolis, Minnesota.
Latest APOG News From Around the Web
Below are the latest news stories about Apogee Enterprises Inc that investors may wish to consider to help them evaluate APOG as an investment opportunity.
Apogee Enterprises (APOG) Down 0.5% Since Last Earnings Report: Can It Rebound?Apogee Enterprises (APOG) reported earnings 30 days ago. What's next for the stock? We take a look at earnings estimates for some clues. |
Sidoti Winter Virtual Small Cap Investor Conference* Presentation Times and Weblinks Released for Over 70 Presenting Companies * Wednesday and Thursday, January 19th-20th, 2022NEW YORK, NY / ACCESSWIRE / January 18, 2022 / Sidoti & Company, LLC has released the presentation schedule and weblinks for its two-day January Small Cap Virtual Conference taking place Wednesday and Thursday, January 19th-20th, 2022. The links can also be found at www. |
Apogee Enterprises' (NASDAQ:APOG) Dividend Will Be Increased To US$0.22Apogee Enterprises, Inc.'s ( NASDAQ:APOG ) dividend will be increasing to US$0.22 on 15th of February. This will take... |
Apogee (APOG) Hikes Dividend by 10%, Boosts Share BuybackApogee (APOG) raises its quarterly dividend by 10% to 22 cents per share and accelerates the existing share repurchase program by 2 million shares. |
Apogee boosts dividend by 10%, increases share repurchase programApogee Enterprises Inc. said Wednesday it will raise its quarterly dividend by 10%, to 22 cents a share from 20 cents. The new dividend will be payable Feb. 15 to shareholders of record on Jan. 31. Based on Tuesday's stock closing price of $47.34, the new annual dividend rate implies a dividend yield of 1.86%, compared with the implied yield for the S&P 500 of 1.31%. Separately, the enclosing commercial buildings and framing art company said it increased its current share repurchase program by 2 |
APOG Price Returns
1-mo | -11.49% |
3-mo | -8.13% |
6-mo | -9.90% |
1-year | 13.65% |
3-year | 12.24% |
5-year | -10.56% |
YTD | -12.67% |
2021 | 55.23% |
2020 | 0.58% |
2019 | 10.89% |
2018 | -33.77% |
2017 | -13.72% |
APOG Dividends
Ex-Dividend Date | Type | Payout Amount | Change | ||||||
---|---|---|---|---|---|---|---|---|---|
Loading, please wait... |
Continue Researching APOG
Here are a few links from around the web to help you further your research on Apogee Enterprises Inc's stock as an investment opportunity:Apogee Enterprises Inc (APOG) Stock Price | Nasdaq
Apogee Enterprises Inc (APOG) Stock Quote, History and News - Yahoo Finance
Apogee Enterprises Inc (APOG) Stock Price and Basic Information | MarketWatch
Loading social stream, please wait...