
Applovin Corp. Cl A (APP): Price and Financial Metrics
APP Price/Volume Stats
| Current price | $77.53 | 52-week high | $91.91 |
| Prev. close | $76.17 | 52-week low | $28.99 |
| Day low | $76.57 | Volume | 1,790,300 |
| Day high | $78.82 | Avg. volume | 4,115,646 |
| 50-day MA | $81.86 | Dividend yield | N/A |
| 200-day MA | $59.63 | Market Cap | 25.51B |
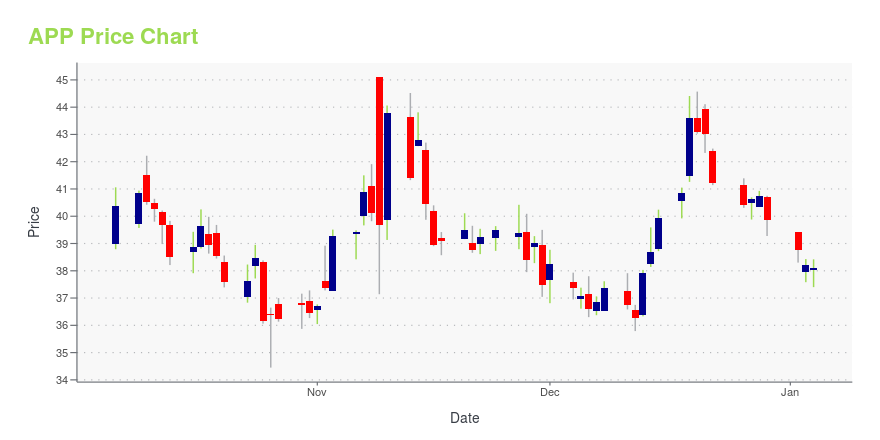
APP Stock Price Chart Interactive Chart >
Applovin Corp. Cl A (APP) Company Bio
Applovin Corporation, doing business as AppLovin, is a mobile technology company headquartered in Palo Alto, California. Founded in 2012, it operated in stealth mode until 2014. AppLovin enables developers of all sizes to market, monetize, analyze and publish their apps through its mobile advertising, marketing, and analytics platforms MAX, AppDiscovery, and SparkLabs. AppLovin operates Lion Studios, which works with game developers to promote and publish their mobile games. AppLovin also has large investments in various mobile game publishers. In 2020, 49% of AppLovin's revenue came from businesses using its software and 51% from consumers making in-app purchases. (Source:Wikipedia)
Latest APP News From Around the Web
Below are the latest news stories about APPLOVIN CORP that investors may wish to consider to help them evaluate APP as an investment opportunity.
Will Investors Give This IBD Stock Of The Day Some Lovin'?AppLovin is the IBD Stock Of The Day as the mobile app marketing firm looks to set a new buy point after several rocky weeks. |
TT vs. APP: Which Stock Is the Better Value Option?TT vs. APP: Which Stock Is the Better Value Option? |
Does AppLovin (APP) Have the Potential to Rally 28.81% as Wall Street Analysts Expect?The average of price targets set by Wall Street analysts indicates a potential upside of 28.8% in AppLovin (APP). While the effectiveness of this highly sought-after metric is questionable, the positive trend in earnings estimate revisions might translate into an upside in the stock. |
AppLovin (APP) Posted Positive Returns Despite ChallengesClearBridge Investments, an investment management firm, released its third-quarter 2023 “Mid Cap Growth Strategy” investor letter, a copy of which can be downloaded here. The strategy underperformed its benchmark Russell Midcap Growth Index in the quarter. Overall, the effects of stock selection impacted the performance on a relative basis. The strategy gained three of the 11 […] |
Building Wealth: Top 3 Stocks to Turn $500 into a Small FortuneAre you looking to build wealth through the stock market? |
APP Price Returns
| 1-mo | -3.67% |
| 3-mo | 5.03% |
| 6-mo | 75.01% |
| 1-year | 158.61% |
| 3-year | 23.75% |
| 5-year | N/A |
| YTD | 94.55% |
| 2023 | 278.44% |
| 2022 | -88.83% |
| 2021 | N/A |
| 2020 | N/A |
| 2019 | N/A |
Loading social stream, please wait...