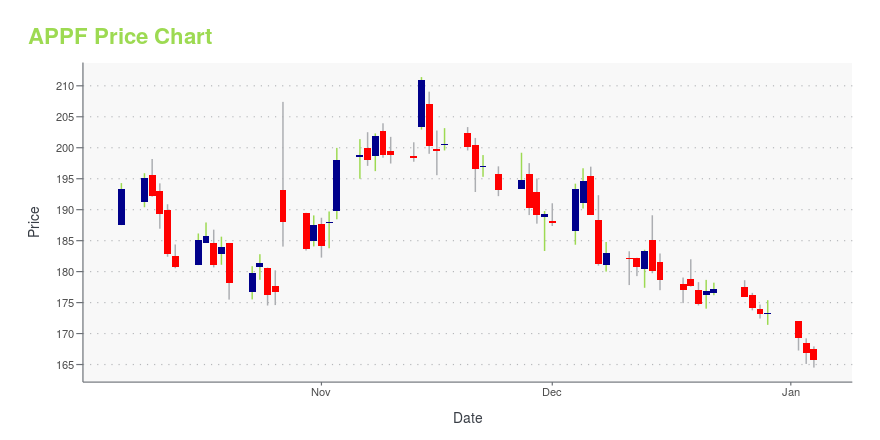
AppFolio, Inc. - (APPF): Price and Financial Metrics
APPF Price/Volume Stats
Current price | $178.84 | 52-week high | $201.91 |
Prev. close | $178.11 | 52-week low | $94.73 |
Day low | $177.71 | Volume | 93,800 |
Day high | $180.45 | Avg. volume | 122,507 |
50-day MA | $182.42 | Dividend yield | N/A |
200-day MA | $144.85 | Market Cap | 6.37B |
APPF Stock Price Chart Interactive Chart >
APPF POWR Grades
- APPF scores best on the Growth dimension, with a Growth rank ahead of 90.06% of US stocks.
- APPF's strongest trending metric is Growth; it's been moving up over the last 179 days.
- APPF ranks lowest in Value; there it ranks in the 3rd percentile.
APPF Stock Summary
- The price/operating cash flow metric for APPFOLIO INC is higher than 99.41% of stocks in our set with a positive cash flow.
- With a price/sales ratio of 12.03, APPFOLIO INC has a higher such ratio than 91.68% of stocks in our set.
- With a year-over-year growth in debt of -26.81%, APPFOLIO INC's debt growth rate surpasses merely 12.07% of about US stocks.
- If you're looking for stocks that are quantitatively similar to APPFOLIO INC, a group of peers worth examining would be NCNO, FLYW, CSBR, ROKU, and ISSC.
- Visit APPF's SEC page to see the company's official filings. To visit the company's web site, go to www.appfolioinc.com.
APPF Valuation Summary
- In comparison to the median Technology stock, APPF's price/sales ratio is 384% higher, now standing at 12.1.
- APPF's price/earnings ratio has moved down 41 over the prior 100 months.
Below are key valuation metrics over time for APPF.
Stock | Date | P/S | P/B | P/E | EV/EBIT |
---|---|---|---|---|---|
APPF | 2023-09-15 | 12.1 | 28.4 | -82.4 | -134.0 |
APPF | 2023-09-14 | 12.1 | 28.6 | -82.9 | -134.9 |
APPF | 2023-09-13 | 12.1 | 28.6 | -83.0 | -134.9 |
APPF | 2023-09-12 | 12.5 | 29.5 | -85.6 | -139.2 |
APPF | 2023-09-11 | 12.7 | 30.0 | -87.0 | -141.4 |
APPF | 2023-09-08 | 12.9 | 30.5 | -88.4 | -143.7 |
APPF Growth Metrics
- Its 2 year price growth rate is now at -5.23%.
- The year over year cash and equivalents growth rate now stands at 10.71%.
- Its 3 year price growth rate is now at 2.79%.

The table below shows APPF's growth in key financial areas (numbers in millions of US dollars).
Date | Revenue | Operating Cash Flow | Net Income to Common Stock |
---|---|---|---|
2022-12-31 | 471.883 | 25.365 | -68.119 |
2022-09-30 | 443.425 | 28.216 | -49.75 |
2022-06-30 | 414.155 | 28.011 | -45.729 |
2022-03-31 | 385.745 | 37.584 | -13.738 |
2021-12-31 | 359.37 | 35.391 | 1.028 |
2021-09-30 | 336.202 | 29.542 | 1.846 |
APPF's Quality Factors
The “Quality” component of the POWR Ratings focuses on 31 different factors of a companies fundamentals and operational strength. Here are some key insights as we drill into the specifics of these quality attributes.- APPF has a Quality Grade of C, ranking ahead of 65.44% of graded US stocks.
- APPF's asset turnover comes in at 0.835 -- ranking 171st of 561 Business Services stocks.
- TCX, HEES, and HGBL are the stocks whose asset turnover ratios are most correlated with APPF.
The table below shows APPF's key quality metrics over time.
Period | Asset Turnover | Gross Margin | ROIC |
---|---|---|---|
2021-06-30 | 0.835 | 0.603 | 1.046 |
2021-03-31 | 0.858 | 0.610 | 1.086 |
2020-12-31 | 0.893 | 0.616 | 1.137 |
2020-09-30 | 0.968 | 0.621 | 1.089 |
2020-06-30 | 1.043 | 0.624 | 0.071 |
2020-03-31 | 1.071 | 0.608 | 0.058 |
APPF Price Target
For more insight on analysts targets of APPF, see our APPF price target page. And for a list of of all stocks sorted by upside potential based on analyst target price, see our Top Price Target page.
Average Price Target | $114.67 | Average Broker Recommendation | 2.1 (Hold) |
AppFolio, Inc. - (APPF) Company Bio
AppFolio Inc. provides products and solutions including, cloud-based property management software and cloud-based legal practice management software. The company was founded in 2006 and is based in Goleta, California.
Latest APPF News From Around the Web
Below are the latest news stories about APPFOLIO INC that investors may wish to consider to help them evaluate APPF as an investment opportunity.
What Makes AppFolio (APPF) a New Buy StockAppFolio (APPF) might move higher on growing optimism about its earnings prospects, which is reflected by its upgrade to a Zacks Rank #2 (Buy). |
AppFolio Unveils Realm-X, the Property Management Industry’s First-Ever Generative AI Conversational InterfaceNew offerings also include leasing productivity tools for large operators, enhanced user experiences for residents, owners & vendors, and new AppFolio Stack™ Partners Ask Realm-X Customers can ask Realm-X any question, such as “How many assigned work orders have had no activity for the past five days?” Tell Realm-X Customers can tell Realm-X to handle common tasks, such as “Draft a text message asking for a status update on these work orders.” Teach Realm-X Customers can teach Realm-X to automat |
AppFolio Insider Ups Holding By 14% During YearLooking at AppFolio, Inc.'s ( NASDAQ:APPF ) insider transactions over the last year, we can see that insiders were net... |
How AppFolio's New Chief Shook Up The Real Estate Software MarketA sudden shift in profitability has put AppFolio, a real estate software firm, on investors' radar. AppFolio stock has shot up 83% in 2023. |
MercadoLibre upgraded, PagerDuty downgraded: Wall Street's top analyst callsMercadoLibre upgraded, PagerDuty downgraded: Wall Street's top analyst calls |
APPF Price Returns
1-mo | -2.71% |
3-mo | 7.06% |
6-mo | 46.53% |
1-year | 79.23% |
3-year | 25.24% |
5-year | 123.55% |
YTD | 69.71% |
2022 | -12.95% |
2021 | -32.76% |
2020 | 63.75% |
2019 | 85.66% |
2018 | 42.70% |
Continue Researching APPF
Here are a few links from around the web to help you further your research on Appfolio Inc's stock as an investment opportunity:Appfolio Inc (APPF) Stock Price | Nasdaq
Appfolio Inc (APPF) Stock Quote, History and News - Yahoo Finance
Appfolio Inc (APPF) Stock Price and Basic Information | MarketWatch
Loading social stream, please wait...