Argo Group International Holdings, Ltd. (ARGO): Price and Financial Metrics
ARGO Price/Volume Stats
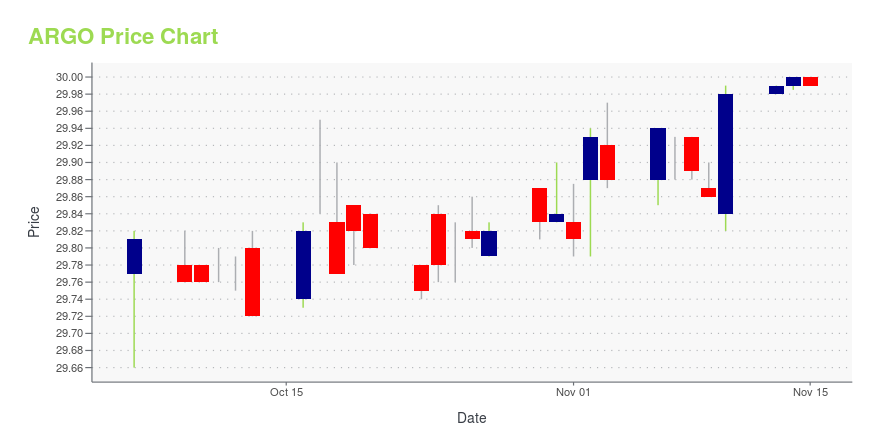
Current price | $29.34 | 52-week high | $43.82 |
Prev. close | $29.34 | 52-week low | $19.00 |
Day low | $29.31 | Volume | 186,800 |
Day high | $29.40 | Avg. volume | 583,570 |
50-day MA | $29.36 | Dividend yield | N/A |
200-day MA | $26.31 | Market Cap | 1.03B |
ARGO Stock Price Chart Interactive Chart >
ARGO POWR Grades
- ARGO scores best on the Momentum dimension, with a Momentum rank ahead of 90.08% of US stocks.
- ARGO's strongest trending metric is Quality; it's been moving up over the last 97 days.
- ARGO's current lowest rank is in the Sentiment metric (where it is better than 0.92% of US stocks).
ARGO Stock Summary
- ARGO's one year PEG ratio, measuring expected growth in earnings next year relative to current common stock price is 0.18 -- higher than merely 2.95% of US-listed equities with positive expected earnings growth.
- ARGO's went public 36.55 years ago, making it older than 92.96% of listed US stocks we're tracking.
- Over the past twelve months, ARGO has reported earnings growth of -2,576.19%, putting it ahead of merely 0.91% of US stocks in our set.
- Stocks with similar financial metrics, market capitalization, and price volatility to ARGO GROUP INTERNATIONAL HOLDINGS LTD are KINS, FORD, NWLI, UVE, and CTBI.
- Visit ARGO's SEC page to see the company's official filings. To visit the company's web site, go to www.argolimited.com.
ARGO Valuation Summary
- ARGO's price/sales ratio is 0.6; this is 72.73% lower than that of the median Financial Services stock.
- ARGO's price/earnings ratio has moved down 7 over the prior 243 months.
Below are key valuation metrics over time for ARGO.
Stock | Date | P/S | P/B | P/E | EV/EBIT |
---|---|---|---|---|---|
ARGO | 2023-05-19 | 0.6 | 0.8 | -4.7 | -7 |
ARGO | 2023-05-18 | 0.6 | 0.8 | -4.7 | -7 |
ARGO | 2023-05-17 | 0.6 | 0.8 | -4.7 | -7 |
ARGO | 2023-05-16 | 0.6 | 0.8 | -4.7 | -7 |
ARGO | 2023-05-15 | 0.6 | 0.8 | -4.7 | -7 |
ARGO | 2023-05-12 | 0.6 | 0.8 | -4.7 | -7 |
ARGO Growth Metrics
- The year over year net cashflow from operations growth rate now stands at -99.08%.
- Its 4 year net cashflow from operations growth rate is now at 3.22%.
- Its 2 year cash and equivalents growth rate is now at -2.96%.

The table below shows ARGO's growth in key financial areas (numbers in millions of US dollars).
Date | Revenue | Operating Cash Flow | Net Income to Common Stock |
---|---|---|---|
2022-09-30 | 1,902 | 158.4 | -191.8 |
2022-06-30 | 1,986 | 144.1 | -120.6 |
2022-03-31 | 2,090.5 | 1.6 | -34.6 |
2021-12-31 | 2,130.3 | 99.7 | -3.8 |
2021-09-30 | 2,116.5 | 11.3 | 112.2 |
2021-06-30 | 2,071.7 | 162.5 | 60.8 |
ARGO's Quality Factors
The “Quality” component of the POWR Ratings focuses on 31 different factors of a companies fundamentals and operational strength. Here are some key insights as we drill into the specifics of these quality attributes.- ARGO has a Quality Grade of C, ranking ahead of 44.77% of graded US stocks.
- ARGO's asset turnover comes in at 0.198 -- ranking 82nd of 133 Insurance stocks.
- SAFT, WRB, and RGA are the stocks whose asset turnover ratios are most correlated with ARGO.
The table below shows ARGO's key quality metrics over time.
Period | Asset Turnover | Gross Margin | ROIC |
---|---|---|---|
2021-06-30 | 0.198 | 0.404 | 0.010 |
2021-03-31 | 0.189 | 0.375 | 0.003 |
2020-12-31 | 0.181 | 0.360 | -0.002 |
2020-09-30 | 0.178 | 0.330 | -0.011 |
2020-06-30 | 0.180 | 0.326 | -0.011 |
2020-03-31 | 0.184 | 0.331 | -0.008 |
Argo Group International Holdings, Ltd. (ARGO) Company Bio
Argo Group International Holdings is an international underwriter of specialty insurance and reinsurance products in the property and casualty market. The company was founded in 1986 and is based in Pembroke, Bermuda.
Latest ARGO News From Around the Web
Below are the latest news stories about ARGO GROUP INTERNATIONAL HOLDINGS LTD that investors may wish to consider to help them evaluate ARGO as an investment opportunity.
Argo Group to join hands with Trisura Group
|
Argo Surety Partners with Trisura GroupCHICAGO, May 24, 2023--Argo Surety Partners with Trisura Group |
New Strong Sell Stocks for May 15thARGO, PFSI and LFCR have been added to the Zacks Rank #5 (Strong Sell) List on May 15, 2023. |
Argo Group International Holdings First Quarter 2023 Earnings: Misses ExpectationsArgo Group International Holdings ( NYSE:ARGO ) First Quarter 2023 Results Key Financial Results Revenue: US$401.7m... |
Argo Group (ARGO) Reports Q1 Loss, Misses Revenue EstimatesArgo Group (ARGO) delivered earnings and revenue surprises of -138.75% and 9.16%, respectively, for the quarter ended March 2023. Do the numbers hold clues to what lies ahead for the stock? |
ARGO Price Returns
1-mo | -0.31% |
3-mo | 1.00% |
6-mo | 13.19% |
1-year | -30.75% |
3-year | -13.95% |
5-year | -48.33% |
YTD | 13.50% |
2022 | -53.62% |
2021 | 36.11% |
2020 | -31.48% |
2019 | -0.42% |
2018 | 25.38% |
Continue Researching ARGO
Want to do more research on Argo Group International Holdings Ltd's stock and its price? Try the links below:Argo Group International Holdings Ltd (ARGO) Stock Price | Nasdaq
Argo Group International Holdings Ltd (ARGO) Stock Quote, History and News - Yahoo Finance
Argo Group International Holdings Ltd (ARGO) Stock Price and Basic Information | MarketWatch
Loading social stream, please wait...